2 Graphical objects
In this chapter we show how to use Therion on a simple example, a short cave (or a part of a cave). Therefore we can do the whole drawing on a single scrap.
Before you start with your first example, we must talk a little about how therion works, and about the syntax of the language. This will help you to learn the most frequently used commands.
You may use data from a survey of yours for this example.
Here is some general advice, to help you start using therion. Many of these things are explained later, but this is a good place to put these guidelines.
It is a good idea to make the drawing of a cave map a piece at a time, so that it is easier to spot errors and to correct them. Even when you are adding a piece to an existing map, work on that piece alone so that you can correct possible errors.
You should start with a simple layout, and enter only the survey data, with no drawing. A thconfig with “.th” data file(s); no “.th2” file. This will produce a map with only the centerline and the stations. With that you should make sure that you did not do any mistake entering the data.
The next step is to add scraps for the drawing. Focus on one map at a time, the plan and the extended elevation separately. You can put output commands for both in the configuration file, but comment the one you do not work on, at this stage.
Work on one scrap at a time. Add the “input” command(s) to the survey data file, but comment those you do not need. To start draw the cave outline only: the “station” points, and the “wall” lines. Do not bother to connect the scraps together properly (with “join” commands), Also do not rush to put in all the extra feature that makes your cave map look great. Make sure you got the right outline, the proper stations, etc.
Unless you are very good drawing cave sketches, it is advisable that you do not use the scanned cave sketches as background images for the scrap, but make a plot of the centerline, draw a sketch of the cave map (following the sketches you made in the cave), and scan this to use as background image.
2.1 Therion files
thconfig (Therion configuration file)
Before we can tackle an example we must discuss the Therion approach. Every run of therion depends on a configuration file, which says what to do and how. The conventional name for this file is thconfig. It contains
- the list of what makes the survey (the data files);
- options about the presentation of the results (symbols, legend, etc.);
- the requested outputs.
There are two kinds of data files.
- survey data, conventionally with extension “.th”;
- drawing data files, conventionally with extension “.th2”.
Therefore the necessary steps to make a cave map with Therion are:
- prepare the survey data files (text editor);
- make the drawing data files (map editor of
xtherion); - write a suitable configuration file
thconfig; - compile everything with
xtherion.
If everything went well, the result is a pdf file that you can view with any pdf viewer. If there are errors, these are shown in the lower part of the compiler window, and you must correct them.
TeX (program)
MetaPost (program)
cavern (program)
We have seen that Therion relies on three external programs: cavern, pdfTeX and MetaPost (which uses TeX). Indeed if you browsed through the output of the compilation in the lower part of the compiler window, when you have run the test that comes with the distribution, you could have noticed the log of these programs.
xtherion just calls therion. Infact you could compile your cave project without xtherion, by invoking therion from the command prompt. The syntax of the therion command is described in app. 2.c.
2.1.1 Configuration file
The configuration file thconfig contains the data files (with pathnames relative to its directory), listed with the command
source file.th
It may contain layout definition blocks. For instance,
    layout xvi_export
        scale 1 500
        grid bottom
        grid-size 10 10 10 m
    endlayout
grid (layout command)
The grid command says to draw the grid on the map. The value “bottom” says to put it on the lowest layer so that it does not cover the cave drawing. If instead of “bottom” you write “top” the grid appears over the cave drawing [thexample 6]. The command grid-size defines the grid step, in X, Y and Z. You can also give the coordinates of the grid origin with the command grid-origin followed by the three coordinates [thbook 40].
The configuration file contains the commands that say which outputs to create. For example,
    export model -fmt survex
    export map -fmt xvi -layout xvi_export -o file.xvi
    export map -proj extended -fmt xvi -o extended.xvi
    export map -proj plan -o plan.pdf
    export atlas -proj plan -o plan_atlas.pdf
Further details on the syntax of the configuration file are in app. 2.a.
2.1.2 Survey data
SVX (Survex data format)
The survey data files (extension .th) have a syntax very close to that of survex 1 , but there are a few important differences:
- comments begin with '#' instead of ';'
- keywords do not have the initial '*'
- in place of “begin”-“end” therion uses
survey-endsurvey - therion refers to the stations as “station@survey.cave” instead of “cave.survey.station”
- there is no “export” command
- the survey data must be enclosed in a
centerline-endcenterlineblock - the separator of decimals is the point '.'
- the “*title” command is replaced with the option “-title” of the
surveycommand
The syntax of therion data files is described in app. 2.b which lists also the commands for the drawings. For the time being you can get by with the following:
- a survey file starts with the command “survey”. This is followed by the survey ID and, optonally, by the survey title, on the same line. For example: “survey gm0 -title Grazie_Mille”. The “survey” command is like an open brace; it must be closed with the command “endsurvey”.
- inside the block “survey”-“endsurvey” there can be one or more centerlines (block “centerline”-“endcenterline”), and other surveys. Inside the blocks “centerline”-“endcenterline” you write the survey data and other commands.
- the command “data” states the style and the order of the data on the survey data lines. Example: “data normal from to length compass clino”.
- the command “fix” defines the geographical coordinates of a station. Example: “fix 1 575628 4476124 1250”. You can repeat the “fix” for several stations, thus fixing more points.
- the command “date” specifies the date of the survey. Example: “date 2002.05.18” is May 18, 2002.
- the command “team” specifies the name of a surveyor and his/her roles. Example: “team “S./Mudrak” compass clino”.
- the command “units” defines the units for one of the values. For example “units length 0.01 meters” says that lengths are in centimeters. By default distances are in “meters”, and angles in “degrees”.
- the command “declination” specifies the magnetic declination correction. Inside a “survey” it applies to all the centerlines; otherwise put it inside a “centerline”.
- the survey data are written a shot per line, and in the order defined in the “data” command. As separator of decimals use the point '.'
- comments start with the character '#'
The survey data file must have a block survey/ endsurvey enclosing everything, except the command encoding. Therefore the survey is a container of all other objects. As it can contain also other surveys, it is possible to structure the surveys data (including the data of the drawings) hierarchically. survey is like a directory in a filesystem. Just like a directory it has a name, which is used to refer to the survey. The name of the survey (the ID) is written after the “survey” command on the same line [thbook 12].
centerline (.th command)
survey can contain, in a centerline/ endcenterline block, the command input which includes another data file (a drawing file, or a survey file).
    encoding UTF-8
    survey nome -title "cave title"
      centerline -extend left
        title "survey title"
        date 2006.10.26
        team "nome/surname" notes
        team "nome/surname" clino compass tape
        data normal from to length clino compass
        1 2 4.37 12.5 321
        2 3 12.56 10 276
        ...
        ...
        input file.th2
      endcenterline
    endsurvey
The centerline command can be spelled also centreline.
extend (.th command)
The centerline command in the above example has the option “-extend left”. This says to draw the extended section from right to left. By default therion draws it from left to right. Alternatively you can write the command extend followed by “left” or “right” in the middle of the data lines and the shots that follow are drawn as stated in the command. If it is followed by “normal” or “reverse” the shots that follow are extended as the shot before the command or in the opposite side, respectively [thbook 16]. There is also “extend ignore” for shots that should not appear in the extended section.
The extend commands shuold be placed according to the cave sketch drawings. If the cave in the sketch goes to the right and you write “extend left” in your data the outcome is probably not what you expect.
input (therion command)
The command input is used to include another data file. In the above example it includes a drawing data file (extension .th2). If the file has extension .th, this can be omitted [thbook 12].
2.1.3 Drawing data
The file with the drawing data (called scrap) are text files with commands for points, lines, areas, symbols, etc. These commands are interpreted by therion when you compile the project to produce input files for MetaPost.
The drawing commands are listed in app. 2.b, and will be described as we go along with therion using sample data.
2.2 xtherion
Let's start with a very simple example: a configuration file and just one survey data file. Since therion files are text files you can write them with any text editor, but it is easier to use xtherion.
The advantage of xterion is that while you write them you can try and compile your project, and if there are errors you can correct them. xtherion helps you highlighting the error message in the output window (the lower window) and linking this to the line in the source file that caused the error.
Now run xtherion which starts with the compiler mode. You can create a new configuration file (menu “File | New”), or open and existing one. Create a directory for this example and move into it. Put in there the files for this example
- thconfig, configuration file
- gm0.th, survey file
- gm0.th2, drawings file
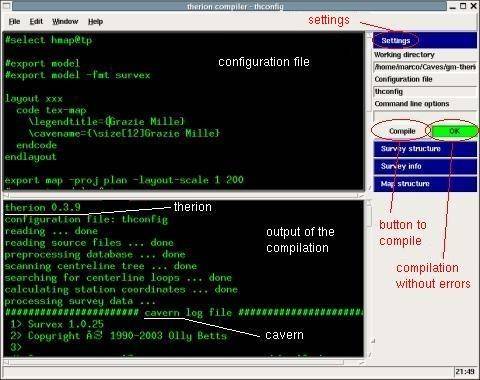
Open the file “thconfig” with xtherion (menu “File | Open”). It says to use the data file “gm0.th”, it defines a layout (named “xxx”) with two lines of code for TeX, and two output commands (“export”); the first for the extended section (scale 1:200), the second for the plan, with several layout options.
Now switch xtherion into “Text Editor” mode and open the data file (menu “File | Open”). This is almost a survex data file, with slight syntax differences, but you should not have much trouble in understanding it. If you have a problem, you can read the therion data syntax in app. 2.b.
Now you can compile everything (menu “File | Compile”). xtherion switches to “Compiler” mode and near the “Compile” button of the panel, there will appear a yellow “RUNNING”. After a while it should turn into a green “OK”. If it becomes a red “ERROR” it means that something went wrong: check the output for error messages. If there is no error message (and therion has generated a pdf) the error might be due to a missing program (or incorrect installation, or runtime environment): make sure that therion can find the programs it needs (cavern, metapost, and pdftex).
You can see the pdf output with a pdf viewer. There is not very much: only segments at the positions of the stations and a few lines of header. After all the data amount only to the survey and there is no drawing data yet.
Before continuing, however, play a little more by adding the different layout options, to see how the pdf changes. Refer to app. 2.a for more datils on the commands of the configuration file.
2.3 Text editor
The text editor of xtherion allows to write and edit (and save) survey data. These files must be written using the therion syntax to be used by therion, see app. 2.b.
To switch to the text editor, select the menu “Window | Text editor”. Next open a survey data file (extension .th) with the menu “File | Open”, or create a new one with the menu “File | New”.
2.3.1 Control panel
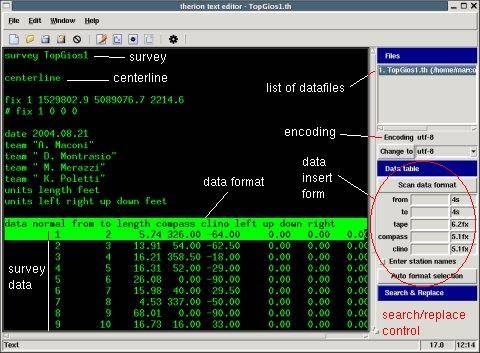
The control panel of the text editor contains
- the list of the open data files in the Files control. Indeed it is possible to open more files at once. Clicking on the name of the file in the list will bring it up in the editing window.
- the current encoding, with the option to change it selected among the available ones;
- a form to input the data in the control Data table;
- a Search and Replace control to search in the data file open in the editing window.
2.3.2 The "Data Table"
The “Data Table” of the control panel simplifies entering the survey data [thbook 29]. After writing the length you move to the next entry (“compass”) pressing either the “Enter” key or the “Tab” key. In the same way you move to the “clino” entry. Finally to insert the data in the file you press “Enter”. If you press “Tab” the cursor moves to the “from” entry.
At each data insert, the “Scan data format” form is updated for the next data entry. For instance if you have just typed in the data for the shot 16-17, the “from” text entry becomes “17” and “to” becomes “18”. If the “Enter station names” checkbox is active the cursor is positioned on the “from” entry (the value is updated in this case too). If the checkbox is not active the cursor is on the “length” text entry.
The entries on the left column defines the precision of the data, i.e. the number of figures after the point for the values written in the file. For example “6.2fx” for the length says to write the values with two decimal figures. For the station names “.6s” states to write the first six characters of the names.
scan data
The “Auto format selection” button should set the data format according to the written data, The workflow is
- write (or copy and paste) the data format line;
- press the “[Enter]” key;
- when the cursor is just under the data format line press the “scan data format” button;
- type the survey data in.
According to S. Mudrak,
first press the “scan data format” button. This updates the format > to the style of your data. Then you can modify the format strings (that > follow the printf() C function style), to format the data in the table.
Be careful that the data entered in the table are inserted in the file (opened in the editing window) at the current cursor position. Therefore, before using the “Data Table” put the cursor on a blank line in the “centerline” block. The automatic insertion goes to a new line after each data line.
search
2.3.3 Search and Replace
The text editor panel, as well as that of the map editor, has a control to do text search and, optionally, replacement in the open file. The therion files are all text files; even the drawings are written as textual commands. Therefore these searchs are always textual searches.
In the text editor the result of a search is displayed on the file highlighting in red the word (or the words) that has been found. For the map editor the result is shown in the drawing window highlighting the graphical element found by the search.
This feature is described in section 4.4.
2.4 Map editor
In the map editor mode xtherion can write, edit, and save files with drawing data, called map files. The syntax of these files is not complex at all. It is however better to use the map editor than to write the commands with a text editor because of the numerical values of the command arguments. You should remember that xtherion is not WYSIWYG (what you see is what you get) and it displays points and lines where in the final drawing there will be symbols, labels, and so on. The map editor deals with only a part of the graphical commands of therion. However the map files can be edited with the text editor of xtherion, or any other text editor.
To switch to the map editor mode choose the menu “Window | Map editor”. The window of xtherion shows a drawing canvas and a control panel (on the side). The latter contains the following controls:
- “Objects”: list of the items of the map file
- “Search and select”: to search graphical items in the map file
- “Command preview”: command text as it appears in the map file
- “Points”: point items in the map
- “Lines”: line items in the map
- “Line points”: points of a line
- “Areas”: area items in the map
- “Scraps”: scrap items in the map
- “Text editor”: text editor to insert text verbatim in the map file
- “Drawing area”: control of the drawing canvas
- “Background images”: control for the background images (these images are not included in the output).
The map editor has two operational modes: insert and select. You switch from the “insert” to “select” pressing the escape (“Esc”) key. You switch from “select” to “insert” when you select one of the menus “Edit | Insert” (or with an equivalent command, or shortcut). Depending on the menu you insert points, lines, or areas. Inserting of a scrap or a text leaves the map editor in “select” mode.
2.4.1 Making a drawing
By selecting the menu “File | New” the drawing canvas becomes yellow and is ready to draw. First save the file assigning it a name: menu “File | Save as”.
To open an existing th2 file, use the menu “File | Open”, or “File | Open (no pics)” if you want to open it without loading the background images (which is faster).
The menu “Edit” has submenus specific to the map editor,
- “Insert”, with a choice among “point”, “line”, “area” “text” and “scrap”
- “Insert image” to load a background image.
zoom (Edit menu)
You can move the drawing with a click-and-drag of the right mouse button. You can change the zoom, by selecting the new one in the “Drawing area” control, or with the menu “Edit | Zoom …”.
background
2.4.2 Background images
xvi (Therion vector format)
tkImg (Tcl/Tk extension)
Now open a background image (menu “Edit | Insert image”). xtherion can read images in GIF, PNM, PPM, and XVI format (xvi is the vector format of therion). If you have the tkImg extension of Tcl/Tk installed, xtherion can load also PNG and JPEG images.
NOTE: the program should be able to read images from any directory. However i found that they must be in the directory of the project, that with the thconfig file.
You can load a background image also with the button “Insert” of the “Background images” control. The background images are not part of the drawing but are loaded in xtherion memory and are used to draw the scraps. To remove them use the button “Remove” of the “Background images” control. You can also remove them temporarily from the memory using the “visibility” checkbox, to save system resources, if you need.
You can have more background images at the same time, select one and put it before the others (“Move front”) or behind (“Move back”). Using the slider you can display it darker (move the slider to the left) or lighter (to the right). Finally you can move each one in the canvas independently, using the button “Move to”.
It is not possible to rotate and rescale each image individually. Therefore, it is advisable to prepare the scanned images with the same orientation and the same resolution (pixel per meter, that is same DPI if the images have the same scale) [thbook 29].
auto adjust (Edit menu)
The menu “Edit | Auto adjust” (or the analogous button of the “Drawing area” control) computes the size of the drawing area, using the background images, and resize it in the canvas. [thwiki 2]. After loading a background image select this menu to display it in the drawing area.
scrap
2.4.3 A scrap
A cave map is composed of scraps, and every element of the map must be contained in a scrap [thbook 17]. A scrap is a piece of the drawing that correspond to a portion of the cave with no overlying passages. To faciltate the connection among the scraps to form the whole map, it is advisable to break the map up into scraps where the cave is “simple” (plain walls with no features to be drawn).
Now insert a scrap: select the menu “Edit | Insert - scrap”, or the button “Insert scrap” of the “Objects” control, or the shortcut Ctrl-R. You may notice that the “Command preview” control has a new line which starts “scrap scrap1 …”. This control is useful to see the commands that xtherion writes in the map data file, for each drawing element [thwiki 10]. If you check the “Objects” control you see three lines
     scrap
     endscrap
     end of file
All the elements that belong to the scrap will go between the first two lines.
You can put more than one scrap in a map data file. In this case you have more “scrap / endscrap” sections in the “Objects” control. It is important that when you insert a drawing element one scrap is selected, so that the element will go inside it. When you insert a scrap, this is automatically selected. Therefore if you start inserting drawing elements after having inserted a scrap, these go inside it.
The “Scrap” control lets you change the properties of the scrap. The most important are the projection type and the id (the name of the scrap).
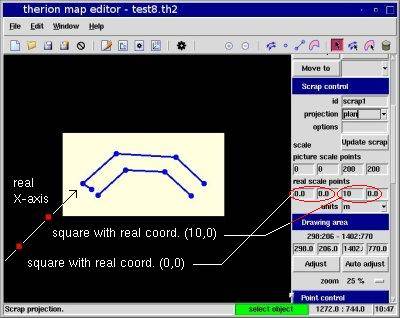
In the canvas there are two small red squares, in the lower part, on the right and on the left. These serve as reference for the scrap when there is only one station in the scrap, such as is the case of cross sections. To define the scale to the scrap you must drag the squares at the opposite corners of a (ideal) rectangle that contains the drawing. For example, the left one on the bottom-left and the right one on the top-right. Next you must assign the coordinates to these two points (expressed in meters if you are using the meter as unit): for example (0,0) to the left one and (width, height) to the right one.
The position of the squares is translated in the “.th2” file into the option of the “scrap” command
-scale [0 0 200 200 0.0 0.0 10 0.0 m]
The first four numbers are the coordinates X1,Y1,X2,Y2 on the drawing. The following four numbers are the map coordinates, followed by the units.
The position of the squares defines also the orientation of the drawing. For example if the squares are placed diagonally in the drawing and we assign them the map coordinates (0,0) amd (10,0), the drawing is rotated by 45 degrees clockwise, as in the figure below.
If the cross section has a different scale than the plan (or the extended section) you must use rescaled coordinates. For example, if the plan is 1:1000 and the cross section is 1:500 you must double the values of the map coordinates.
2.5 Points
A point is the position on the cave map where therion draws cave symbols, labels, stations, etc.
Station points are special. They are very important because they allow you to register the drawing according to the metrics information of the centerline of the survey.
stations
2.5.1 Stations
station (type)
To connect the drawing to the centerline it is necessary to insert station points (ie, points of type “station”) in the scrap. Select the menu “Edit | Insert - point” and click with the left mouse button in the positions on the background image where the stations are. It is not necessary that the background image is drawn perfectly well. therion will take care to stretch it to fit the stations in the survey centerline (ie, their positions measured with the instruments).
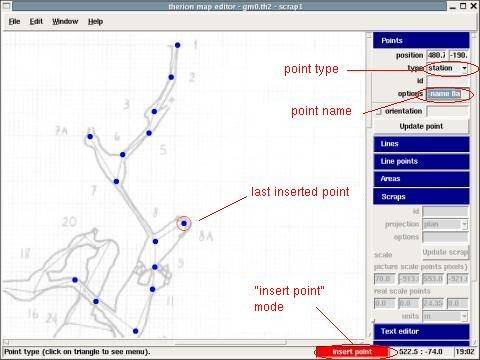
When you are in “insert point” mode, the status bar displays a red “insert point” message. To check that you made no mistake, you can compile (menu “File | Compile”, or key F9) and xtherion switches to the compiler window and compiles the project. If everything is fine, you can barely see the green “OK” message, and xtherion comes back to the map editor window.
In the “Points” control you can choose the type of the point(s) you are inserting. Once selected the type remains unchanged for all the points you insert, until you change it. Therefore it is convenient to insert points in group by the type.
Now insert a few station points and set to them the option “-name N” where N is the station name in the survey data file . As we said xtherion preserves the type of the last inserted point, therefore it is convenient to insert all the stations one after the other. Furthermore xtherion updates the option “-name N” automatically at each insertion incrementing the value of N. Therefore, you need only to be careful and correct it when the station number changes in a different way.
points
2.5.2 Other point types
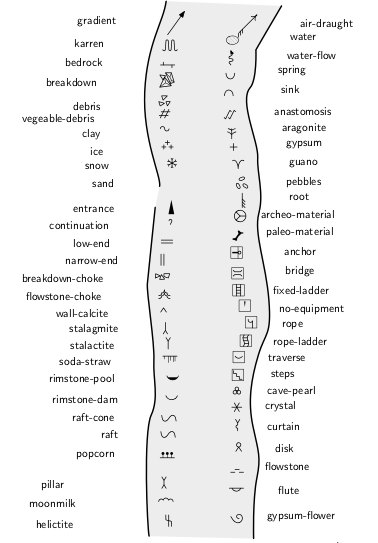
There are many point types. Among them:
- cave symbols: air, water, source, sink,
- geological symbols: anastomosis, breakdown, block, rock, clay, calcite, snow, ice, scallop, sand, pillar, karren, pebbles, gypsym,
- deposits: aragonite, pearl, crystal, disc, stalagmite, stalactite, soda straw, helictite, popcorn, column, moonmilk
- …: height, archeo-material, paleo-material, camp, date, section, root, note, label
- centerline: station
- …: anchor, traverse, rope, ladder, entrance, narrow-end, low-end, continuation
Points are shown in the canvas as blue dots. The last inserted point is always the selected point: it is displayed with a red circle around the blue dot. To change the selected point come out of the “insert point” mode (key “Esc” or menu “Edit | Select”), and click on the point you want to select.
To move a point after having selected it with the left mouse button, it is enough to drag it before releasing the button. To remove a point, select it and press Ctrl-D (or the menu “Edit | Delete”).
orientation
If the point has an orientation (for example points of types “gradient” “water-flow”, “air-draught”, …) it is displayed with a yellow arrow. By default the orientation is 0 (to the north, or vertical). To change the orientation of the point draw the arrow (or write the value in degrees in the appropriate textbox of the “Points” control).
scale (option)
It is possible to change the size of the point symbol with the option “-scale”. The default is “m” (normal). Other values are “s” (small), “xs” (very small), “l” (big), “xl” (very big).
clip (option)
For most of the point types it is possible to specify (option “-clip”) whether to clip the point symbol to the cave outline or not.
visibility (option)
Each point can be hidden with the option “-visibility off” (the default is “on”).
text
Certain point types must have a “-text” option. Points of type “label” must have a text (option “-text”) and can be oriented (in the figure the label is at 45 degrees). The points of type “survey-name” have the option “-text” with the name of the station.
value (option)
Several point types take a “-value” option. The points of type “date” must have a value (option “-value”) otherwise nothing is rendered in the output. The points of type “dimension” are not rendered graphically, but it stores information on the dimensions of the cave passage, up and down if the scrap projection is plan; for example the option “-value 4 2” denotes a dimension of 4 (m) up and 2 down.
The points of type “height” must have a “-value” that can be positive (chimney) or negative (pit), and can have an optional question mark; for example “-value [20? m]”. The points of type “passage-height” must have a “-value” that specifies the height of the passage (positive number, eg, “+4.5”), or the depth of the floor or a pool (negative number), or the distance floor-ceiling (a number with no sign), or a pair of numbers (distances to the ceiling and to the floor, eg, “[5.6 1.2]”). A point of type “altitude” has a “-value” that specifes the altitude with respect to the nearest station. To specify an absolute altitude use the keyword “fix”, eg, “-value [fix 2126]”. A point of type “dimension” has a “-value” to specify the cave dimension above and below the centerline, eg, “-value [2.6 1.5]”.
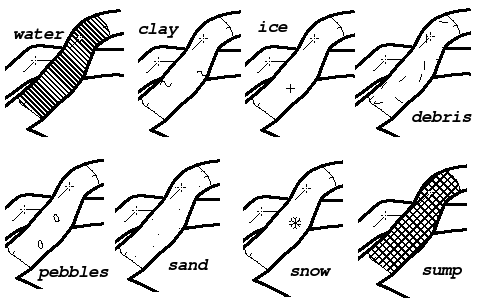
The figures below show how the point symbols are drawn using the UIS symbols (which is the default). Symbols with other sets do not differ that much.
subtype
Some point types have also a subtype. The type “water-flow” can have subtype “permanent” (default), “intermittent”, and “paleo”. Points of type “station” can have subtype “temporary” (default), “painted”, “natural”, and “fixed”.
2.6 Lines
lines
The drawing of a cave map is made, besides of symbols (points) and labels, of lines, curves that denote the walls of the cave, and other linear features. To draw a line select the menu “Edit | Insert - line” (or Ctrl-L). The message in the status bar changes to “Insert line point”: infact a curve is defined by a few points in key positions (sharp corners, middle of a regular piece, etc.). When you are in insert-line mode every point where you click becomes a new point of the line. To end the line you can click on the key “Esc” (and go back to select mode), or you can press Ctrl-L and start inserting points of a new line.
control point
You can draw two kinds of lines: polygonal lines (made of straight segments between the points that you click) and smooth curves. For the former you need to click in the vertices of the polygonal line. For the latter you must click in a point and drag the mouse. This produces a straight segment with the point in the middle and two little squares at the ends. These squares are the control points of the line point. The yellow square is in the forward direction, the red square is backward. The direction of this segment and its length define how the line must pass through the point, ie, its direction and curvature (it depends also on the half-segments of the previous and the next points on the line). If you require that a segment determines the line only forward or only backward you must deactivate the relative checkbox in the “Line points” control: “ <<” to deactivate the backward, “ >>” for the forward. The checkbox “smooth” is active when both the other two are active. This way you have complete control over the curve.
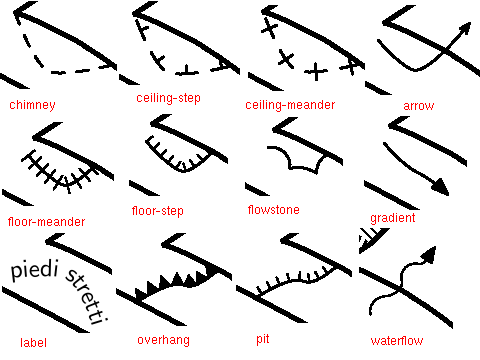
Lines, like the points, have a type. A few types are:
- “wall”, for the walls of the cave;
- “contour” and “border”;
- “chimney” and “pit”;
- “rock-border” and “rock-edge”: the first for the border of blocks, the second for the internal edge lines;
- “section” for the segment of a cross-section;
- “arrow”, “gradient”, are lines ending with a arrow
- “water-flow”.
gradient (line option)
contour (line type)
Lines of type “contour” can have a “gradient” option. This can be “-gradient none” (nothing is drawn; this is the default), or “-gradient center” (the tick is drawn in the middle point). It is also possible to add the option “gradient point” after all the points where you want to draw the tick (you must write “gradient point” in the option box of the line point in the map editor, or you can edit the map file with the text editor).
slope (line type)
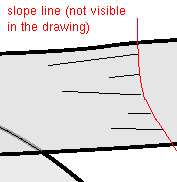
Lines of type “slope” are drawn as segments oriented perpendicularly to the line, passing by the line points. Therefore the orientation of these segments depends also on the control points. At least one of the points of a “slope” line must have a “l-size” which defines the length of the segments. Each point can have an orientation which modifies the default one.
(subtype value)
presumed (subtype value)
subtype
Some types of lines (“wall”, “border”, “survey” and “water-flow”), just like the omonimous points, can have a subtype (option “-subtype”). For instance line of type “border” can be “invisible”: this is used for the borders of areas that must not be drawn in the map [thwiki 17]. Another subtype is “presumed”: for the “wall” lines that are presumed, but also for the lines of type “border”.
wall (line type)
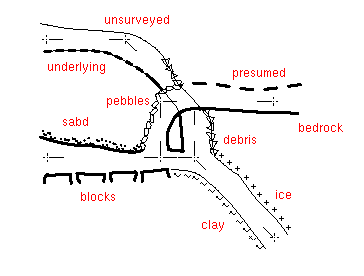
Lines of type “wall” can have subtype “bedrock”, “blocks”, “clay”, “debris”, “ice”, “sand”, “pebbles”, “unsurveyed”, “underlying”, “presumed” and “invisible”. These are shown in the figure below (except “invisible” which says not to draw the line).
Lines of type “water-flow” can have subtype “permanent”, “intermittent” and “conjectural”. Lines of type “border” can have subtype “invisible”, “temporary”, “visible” and “presumed”.
orientation
The lines are oriented: they have a little yellow tick at the starting end. This should point toward the inside of the cave (where there is no rock). Therefore you should draw the walls of the cave counterclockwise, the blocks clockwise, pits and chimneys counterclockwise. If you make a mistake, you can invert the direction of the line by clicking on the “Reverse” button of the “Lines” control in the panel.
If a point belongs to two (or more) lines, when you select the point (left mouse button) a line is also selected. If it is not the line you wanted to select, you can alternate among the lines that pass through the point by clicking with the right mouse button on the selected point [thwiki 17].
Now insert the lines of the cave walls (type “wall”). If you make a mistake delete the line (Ctrl-D) and try again (Ctrl-L).
There are two ways to draw a closed line: either you finish by clicking on the starting point, or you use the “close” check-box of the “Line” control. If, by chance, you close a line that you didn't want to select the last point in the list in the “Line control” control. It should have the same coordinates as the first point. With the menu “Edit line” select “Delete point”, and you remove it from the line (the first point remains on the line).
You can select each individual points on the line. Once selected, a point can be moved (drag with the mouse). You must click twice on the point: the first click select the point and it is displayed with a red circle around. When you click on the selected point a second time (and keep the mouse button pressed) you catch it and you can drag it around. Release the mouse button when the point has moved in the position you wanted.
To remove a point from a line go to the “Lines” control and select the button “Edit line | Delete point”. To insert a point in the line, select, in the same control, “Edit line | Insert point”. This button changes xtherion into line-point insert mode (for the selected line, that is the line for which the control was active), and you can now insert points.
To break a line at the selected point, select “Edit line | Split line” in the “Lines” control. If you want to break the line in a place beyween points, you must first insert a new point. More details in sect. 3.2.
symbols
labels
2.6.1 Symbols and labels
Symbols and labels are associated to points, i.e., to their position in the drawing. Some symbols have an orientation. For example “water-flow” has a direction of flow: make active the “orientation” check box and select the orientation by rotating the yellow arrow attached to the point with the mouse, or by writing the value of the angle (in degrees) in the text box near the check box.
Unfortunately the symbols are not displayed in the map editor window, but only the points are shown, and it is rather difficult to remember what each point refers to. A little help comes from the status bar that displays the type of the point when the mouse is over it.
Labels are points of type “label”. The text to display must be written in the “options” textbos as “-text …”. You may use HTML tags to format the text: <it >for italics, <bf >for boldface, and so on. Use <br >for a new-line, and <right >to right justify the text.
text
2.6.2 Text
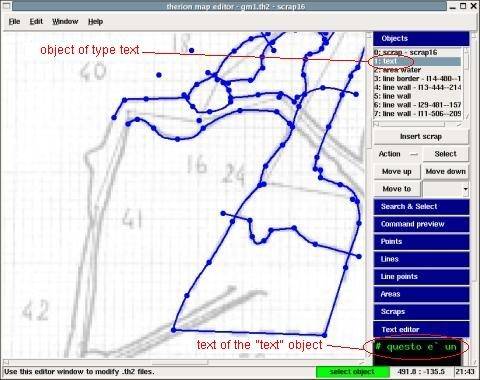
The text area is used to write a text that will be included in the drawing data file. It is used to add commands for MetaPost or pdfTeX (when one needs something special).
Select the menu “Edit | Insert - text”, or in the “Objects” control of the panel, select the command “Action | Insert text”. This opens the “Text” control, and you can enter your text in the black text-area. Whatever you write will be inserted literally in the data file.
As for the labels you can use HTML tags to format the text. For example to go to a new-line write <br >[thbook …].
Now try it and insert a comment in your data file.
cross section
2.6.3 Cross sections
section (type)
A cross section is a scrap and is associated to a position in the drawing of the plan or in that of the extended section. This position is specified with a point of type “section” and must have the option “-scrap” followed by the name of the scrap of the cross-section.
scale (option)
The scrap of the cross-section has another peculiarity. It usually has only one station; therefore it must have the option “-scale” so that therion can know its dimensions.
Cross-sections are further discussed in sect. 3.5.
2.7 Areas
area
An area is a portion of the cave filled with something. For example a pool of water is displayed as an area of type “water” (or “sump” if it is a sump). Other graphical elements are areas because they fill a region of the drawing: “sand”, “debris”, “mud”, etc.
outline
An area is defined by the lines that make its contour. These must intersect two by two, and must be listed in order, either clockwise or counterclockwise. If the lines do not intersect (ie, they do not define a closed contour) the result is unpredictable. When you draw the lines of the border of an area (type “border”), either visible or not (subtype “invisible”), you should extend them a litle beyond the walls of the cave, to be sure that they intersect. In fact therion does not draw the portions of line that extends outside of the cave outline (which usually is defined by the cave walls).
To insert a new area, i.e. to switch to insert area mode, select the menu “Edit | Insert - area”, or the shortcut Ctrl-A. Each line over which you click is added to the list of lines that makes the contour of the area. When you are done press “Esc” (to switch back to selection mode), or Ctrl-A to inert another area.
Be careful not to click twice on the same line, otherwise it appears listed twice in the area contour. You see this in the “Areas” control which displays the list of the lines of the contour. If a line is repeated twice (incorrectly), you should drop it one time so that it appears only once.
You can drop a line from the contour of an area. Select the line and press the button “Delete in the “Areas” control. The line is dropped from the list of the area contour, but it is not deleted from the drawing.
The only way to select an area is through the “Objects” control, by clicking on the entry of the area. You can notice that a line of its contous appears selected in the window.
The “area” command has as argumemnt only the type of the area. This can be one of the following
- “water”, pool of water
- “sump”
- “sand”
- “debris”
- “blocks”
- “snow”
- “ice”
- “clay”
- “pebbles”
place (option)
clip (option)
visibility (option)
The options of the “area” command are
- “place” defines the level on which to draw the area. It can be “bottom”, “top” , or “default”.
- “clip” specifies whether the symbol (of the area) if clipped to the cave outline or not. It can be “on” or “off”.
- “visibility” can be “on” or “off”.
- “context” displays the drawing of this area as if it were another type of area.
context (option)
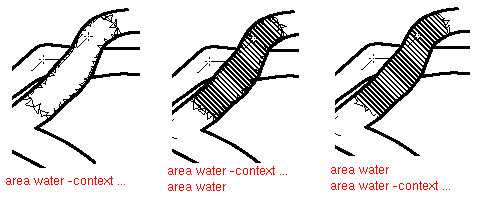
The example below has an area of type “water” bordered by lines of type “wall” and “border”. One of the “border” lines, the one in the lower part, has the option ”-visibility off“. The area has the context ”-context line wall:debris“. The outcome is that the area is drawn with the “debris” symbols on its contours, and the “water” is not drawn. To draw the “water” you can add a second area with tha same contour, but without “context”. If the area with the “context” is above the other in the list of the “Objects” control, it is drawn above the other, and the triangles of the “debris” are shown along the border and the wall lines. If it is listed below the other, it is covered by the “water”, and the triangles of the “debris” are shown only along the “border” lines
For the lines the “context” option seems to change the type of the line. For example a line of type border with a -context line overhang” is drawn as a line of type overhang.
The same thing happes for the points. A point of type “moonmilk” with “-context point entrance” is drawn with the entrance symbol. There are exceptions: a point of type “label” is always written with the text of the label.
2.A thconfig syntax
thconfig (Therion configuration file)
The configuration files [ThBook 38] are text files with lines of comments (begining with '#'), and lines of commands. Commands can be one-line or multiline. In this case there is a termination command, whose name is made by prefixing “end” to the name of the command. One-line commands can be continued on more lines by ending the line with the continuation sequence (backslash followed by newline).
encoding (therion command)
encoding. It specifies the encoding used for the data. Examples: UTF-8, ASCII, ISO-8859-1, …
source (thconfig command)
source.
It is used to list a data file that must be processed by therion.
input (therion command)
input.
It is used to include a file, just like the C-preprocessor “#include” directive. It cannot be used inside a block layout- endlayout.
select (thconfig command)
select.
This command selects an object (either a survey or a map) to export in the outputs. The selection rules allows us to organize maps and scraps with versatility [thbook 38].
- By default, if there is no “select” command with a survey all the surveys are selected for export.
- If only surveys are selected, and there is no “select” command for a map, all the maps of the selected surveys are exported.
- if surveys are selected and there is no
mapdefinition in the selected surveys, all the centerlines of the selected surveys are exported. - if there are selected maps, they are exported.
The “select” command has options,
- recursive, it applies to a survey “select”: it states that all the subsurveys of the survey are selected, recursively.
- map-level N, it applies only to a map “select”: it states the level at which to stop the export of the map when generating an atlas.
- chapter-level N, it applies only to a map “select”: it states the chapter-level at which to stop the export of the map when generating an atlas.
unselect (thconfig command)
unselect.
Is the opposite of select. It is used when you want to include an object in an export, and not to include it in the following exports. You put a “unselect” of that object between the export commands.
layout (thconfig command)
layout.
It specifies a set of 2D layout options. It takes, as argument the id (name) of the layout, that must be used in the following to refer to it. It has several options. Among them:
- copy Layout_id copies the options of another layout into this;
- scale from to defines the output scale. For example “scale 1 500”. The default is 1:200.
- base-scale from to rescales the output by a factor scale/base_scale;
- units has argument “metric” (default) or “imperial”;
- rotate degrees, rotate the drawing in the output.
- symbol-set set specifies the set of symbols to use: UIS (Union Internatinale de Speleologie), ASF (Australian Speleological Federation), CCNP (Carlsbad Caverns National Park) or SKBB (Speleoklub Banska Bystrica); for example “symbol-set UIS”. At the moment the symbols do not differ that much.
- symbol-hide specifies symbols or group of symbols that must not be drawn. Examples: “symbol-hide group cave-centerline”, “symbol-hide point cave-station” … There is also symbol-show.
- size width height units specifies the dimension (for the maps the option page-grid must be “on”). Example: “size 18 22.2 cm”
- overlap value units
- grid has argument “off” (default), “top” or “bottom”
- grid-origin specifies the coordinates of the grid origin. Example: “grid-origin 0 0 0 m”
- grid-size defines the grid spacing (default 10 m). Example: “grid-size 50 m”
- transparency has argument “on” or “off”, and defines whether the cave passages that lie below must be visible (the default is “on”, and should be used with the option opacity)
- opacity defines the opacity value, between 0 and 100, of the passages underlying (the default is 70)
The following options apply only to atlases:
- page-setup defines the size of the page. It has arguments the numerical value and the units. For example, “page-setup 29.7 cm”
- page-numbers has argument “on” (default) or “off”
- exclude-pages has argument “on” or “off”, and the list of the page-numbers to exclude (page-numbers start at 1). For example, “exclude-pages on 2,3,6-8,19”
- title-page has argument “on” (default) or “off”. It refers to the title pages in front of the chapters.
- nav-factor defines the zoom factor of the navigation grid. The default is 30.
legend (layout option)
Legend options:
- legend has argument “off”, “on” or “all”
- scale-bar. For example “scale-bar 10 m”. The grid step is adjusted to the scale-bar if it is not specified with the option grid-size.
- map-header has three arguments: X, Y, and one among “off”, “center”, “n”, “e”, …, “sw”. For instance, “map-header 0 0 n”
- statistics adds some statistics. It it has argument “explo-length” or “topo-length”, it can have value “on” or “off”. The first states to write the statistics, the second not to write them. When it has argument “explo”, “topo”, “carto” or “copyright” the value can be “all” (it writes all the names), “off” (it does not write anything), or a number N (it writes the first N names).
- language has argument the language to use in the output.
- map-comment is followed by the string of the comment you want to include on the output. The comment is placed between the drawing and the legend.
- debug can be “on”, “all”, “first”, “second”, “scrap-names” or “off”
Finally there are PDF specific options. Their name is rather self-explanatory. They assign values to properties of the PDF document, and are followed by the string value (enclosed in double quote marks if it contains spaces).
- doc-author
- doc-keyword
- doc-subject
- doc-title
export (thconfig command)
export.
It defines a output that must be created. It has argument the output type, “map”, “atlas”, “model” or “database”. Among the options there are,
- output specifies the name of the output (file). By default this is “cave.XXX” where the extension “XXX” varies according to the format of the output.
- fmt specifies the format of the output. The possible formats depend on the type of the output:
- * maps can be “pdf”, “svg”, “xvi”.
- * atlases are only “pdf”
- * models can be “therion” (native format, the default), “compass” (plt), “survex” (3d), “dxf”, “vrml”, and “3dmf”
- * databases are only “sql”
- enable and disable, (only for models) select which elements to export in the output: “wall”, “centerline”, “surface”, “all”;
- projection ID (for maps and atlases) specifies the type of the projection, as for the scraps. It can be “none” (cross-sections), “plan” (horizontal projection), “elevation” (vertical projection, possibly with the projection direction in degrees), and “extended”.
- layout ID (for maps and atlases) includes a previously defined layout.
- encoding (for databases) specifies the output encoding.
- It is possible to define also layout options by preceeding them with the prefix “layout-”.
2.B Data syntax
The therion data syntax is thoroughly explained in the Therion book [thbook 10-11].
The therion data files are text files, with lines of commands (with arguments and options), lines of data, and lines of comments (these begin with a character '#'). The commands can be single-line or multiline. In this case there is a termination command, that is a command with the name made by prefixing the command name with “end”. For example the command centerline is terminated by the command endcenterline.
The data lines can contain numerical values or options for the command. In the case of options this applies to the data that follow.
colors
The character '#' marks the beginning of a comment. Inline comments are allowed: everything that follows a '#' up to the end of the line is treated as comment (and ignored). The backslash character ' at the end of a line denotes continuation on the following line as if they were a single line. Arguments and options with spaces must be enclosed in quotations '“', if they are character strings, or square brackets '[' ']', for numerical values. For example the value of a RGB color is composed by three numbers (between 0 and 100) and is written in square brackets: for instance [100 0 0] is the red color.
The keywords may contain the letters of the alphabet, digits, underscore '_', minus sign '-', and slash '/'. Words can contain also plus sign '+', star '*', comma ',', period '.', and single quotation ”'“. To use a keyword as value in a data line you must prefix (escape) it with an exclamation mark '!'.
date
The format of the dates is yyyy.mm.dd$hh:mm:ss.ss. A time interval is composed by two dates joined by a dash (minus sign '-'). The name of a person is made of two strings separated by a space, i.e., “name surname”. Only one space is allowed. Among the units there are meter centimeter (also m and cm), degree ( deg) and percent.
2.B.1 therion commands
contexts
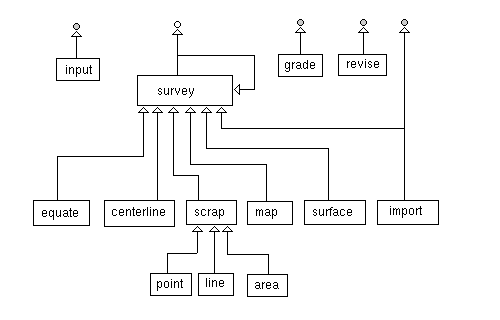
therion commands have a context, ie, a command must occur inside another which is its context. The following figure shows the hierarchy of contexts: the contexts of the commands are shown as arrows.
encoding (therion command)
encoding tipo.
This command defines the encoding used to write the data that follows. For example encoding UTF-8 or encoding ASCII.
input (therion command)
input file.
This command tells therion to read in another file. If the filename contains a directory separator you should use the slash '/' for better portability. It is good practice to avoid absolute names.
survey (.th command)
survey name.
This command defines a level in the namespace of the surveys. The name of the level is the argument to the command (the name of the survey). Among the option there are declination (to specify the value of the magnetic declination correction that must be applied to the data) and title, that defines the title of the survey.
centerline (.th command)
centerline or centreline.
This command defines the start of survey data. It has several options:
date date_valueteam person [roles]units quantity [factor] units: units for a certain quantity. A scale factor can be specified, eg, “units length 0.01 meters”.sd quantity value units: standard deviation for a certain quantity.declination value unitsinfer what on/off, eg. “infer plumb on” specifies that the shots +/- 90 must not be corrected in inclination. “infer equates on” states that shots of length 0 must be treated as “equate” commands (no error correction).mark [stations] type, where the type can be fixed, painted, or temporarystation station commentassociates a comment to a station. If the comment has spaces it must be enclosed in quotations '”'. Example: station 32 “continuable, with less rock”.fix station x y z: fixes the geographical coordinates of a station. Example “fix 1 1529802.9 5089076.7 2214.6” defines the coordinates (in this case the reference system is Roma-40) of station 1: X is the east coordinate, Y the north one, and Z is the altitude. They are all in meters.flag: “flag surface” specifies that the shots that follow belong to a surface survey, and do not count in the statistics of the cave. “flag duplicate” denotes shots that are duplicates, and do not count towards the cave length.equate stations: defines the coincidence of two stations. For example “equate 1 24@main_passage”.data style data_order: defines the type and order of the survey data on the data lineswalls type: the type can be auto, on, or off. It specifies whether the LRUD data must be used in generating the 3d models.extend type [stations]: it is used for the extended section. The type can be left, right, break, start, ignore
scrap
scrap.
A scrap encloses a portion of cave map that contains no overlapping passages. It usually covers about a hundred meters of cave passages. It contains points (symbols and texts), lines, and areas. The contour of the scrap is formed by lines with the option -outline. This can be “out”, “in” or “none”. Lines of type “wall” have -outline out by default. Other lines have -outline none by default. The lines of the contour must not intersect, otherwise MetaPost gives a warning message ( therion sees the message but continues). It is good practice to check for these messages and fix them anyways.
A scrap must have two stations that provide its reference frame. If it has only one station (or none), as is the case for most cross-sections, it must have the option -scale. The scrap options are
projectionspecifies the type of projection. It can be none (cross sections), plan, elevation (vertical projection), and extended (extended elevation).scalestations …lists the stations that must be drawn in the scrap and are not listed among the points.walls. It can be “on”, “off” or “auto”. It specifies whether the scrap should be used or not in the 3d reconstruction.…authorspecifies the author of the scrap;titlespecifies the title of the scrap;copyrightspecifies the scrap copyright.
point (.th command)
point x y tipo.
This command defines a point in the drawing, giving its coordinates and its type. Most of the cave symbols are associated with types of points. Text labels are also point objects. There are also points that do not have a representation on the drawing (for instance points that define the dimensions of the passage). The types of points are
- objects:
station (type)
- * “station”; it must have the option “-name” with the name of the station section (type)
- * “section” is a reference for a cross-section, that is specifed with the option “-scrap”
- * “dimensions” specifies the dimensions of the passage. It must have the option “-value”
- labels
- * “label”,
- * “remark”, a note
- * “altitude”, to show the altitude of the point relative to the grid.
- * “height” is used for the height of cave features such as chimneys.
- * “passage-height” for the height of the passage;
- * “station-name”, to write the name of a station on the map.
- * “date”, for the dates
- fillings: “bedrock” (solid rock), sand, raft, clay, pebbles, debris, blocks, water, ice, guano, snow
- speleothems: flowstone, moonmilk, stalactite, stalagmite, pillar, curtain, helictite, soda-straw, crystal, wall-calcite, popcorn, disk, gypsum, gypsum-flower, aragonite, cave-pearl, rimstone-pool, rimstone-dam, anastomosis, karren, scallops, flute, raft-cone
- riggings: anchor, rope, fixed-ladder, steps, bridge, traverse, camp, no-equipement
- entrance and terminations: continuation, narrow-end, low-end, flowstone-choke, breakdown-choke, entrance;
- others: archeo-material, paleo-material, vegetable-debris, root, water-flow, spring (water source), sink (of water), air-draught (the intensity is specified by the option “-scale”), gradient
place (option)
clip (option)
context (option)
Certain types of points can have options:
- -subtype:
- * “station” can have subtype “temporary”, “painted”, “natural” and “fixed”;
- * “water-flow” can have subttype “permanent”, “intermittent” and “paleo”
- -orientation, the value is given in degrees
- -align: usually for texts. It can be “center”, “top”, “left”, etc.
- -scale specifies the dimension of the symbol from extra-small to extra-large: “xs”, “s”, “m”, “l” or “xl” (“tiny”, “small”, “normal”, “large”, “huge”). At a global level the dimensions of the symbols can be set with the layout option “base-scale” (or with the command “u:=dimension” in a “code metapost” section, e.g. “u:=10pt”, “length:=dimension” for the lines).
- -place, specifies the level where to place the symbol, during the construction of the map. For example “-place bottom”.
- -clip, specifies whether the symbol is clipped to the scrap outline or not.
- -visibility, if “off” the symbol is not drawn
- -context, defines the context of the symbol, ie the current symbol is drawn as the context symbol in the output.
- -id, defines the id of the symbol.
- -name, for points of type “station” specifies the name of the station.
- -extend,
- -scrap,
- -text,
- -value.
line (.th command)
line type.
The “line” command, like the “point” command, has a type: wall, contour, slope, … or it can be a filling, a label, or a special line type (border, arrow, section, survey).
The difference between “gradient” and “slope” is that the first draws a single arrow (in the direction of the line), while the second draws several ticks (in directions roughly orthogonal to the line) [thmail 2006-05-05].
visibility (option)
The “line” command can have options:
- -subtype. The following subtypes are possible
- * for the “wall” lines: invisible, bedrock, sand, clay, pebbles, debris, blocks, ice, underlying, presumed;
- * for the “border” lines: visible, invisible, temporary, presumed;
- * for the “water-flow” lines: permanent, conjectural, intermittent (temporary)
- * for the “survey” lines: cave, surface,
- -close can be “on” or “off” and it specifies whether the line is a closed path or not.
- -mark,
- -orientation,
- -outline, specifies whether the line is part of the contour of the scrap (if it has value “in” or “out”) or not (value “none”). By default lines of type “wall” have “-outline out” and the others do not have outline [thwiki 9].
- -reverse, states whether the direction of the line is reversed;
- -size, defines the thickness of the line;
- -smooth,
- -adjust, is used for horizontal (value “horizontal”) and vertical (value “vertical”) straight lines: the points with this options are aligned with the previous point, horizontally or vertically, respectively. It has effect only in elevation maps, not for plan maps.
- -place specifies on which level to place the line when the map is generated. It can be “default”, “bottom”, or “top”.
- -clip can be “on” or “off”;
- -visibility specifies whether the line should be drawn or not. It can be “on” (default) or “off”.
- context defines the context of the line, ie, which line type should be used to draw the line.
- -altitude,
- -border,
- -gradient,
- -head,
- -text.
area
area.
An area is defined by the lines that make its contour. These can be of any type, but they must be listed in order, and intersect each other consecutively. The simplest way to ensure that this is the case is to draw a closed line and use only that for the contour of the area. However this is often not possible.
The “area” command has a type (the type of the area):
- water, a pool of water, a pond
- sump,
- sand,
- debris,
- blocks,
- snow,
- ice,
- clay,
- pebbles.
The “area” command can have options:
- place specifes on which level to place the area to make the map. For example, “-place top”.
- clip can be “on” or “off”. This option is important when you must join scraps and you need to continue an area beyond the outline of the scrap it belongs: add the option “-clip off”.
- visibility can be “on” or “off”. If it is “off” the area is not drawn.
- context defines how to draw the area, ie, which area type to use to draw it.
join (.th command)
join.
The “join” command connects two scraps, or a set of two or more points of the map. It is advisable to put the joins in places where the cave is simple (a passage with no features), otherwise you must put “join” commands for any object. There are two syntaxes of “join”: > join point1 point2 … pointN
join scrap1 scrap2
In the first case you join the points. The point name used in the “join” command must be id of scrap points (“point” command) or line-points (point belonging to a “line” command). In the latter case the id is the line-id followed by the point index; for example “my_line:2” denotes the third point on the line “my_line” (point indices start from 0). “my_line:end” is the final point of the line “my_line”.
Examples of “join” are in chapter 3. See also joining_scraps_together
wall (line type)
In the second case you join two scraps. Only the lines of type “wall” are joined. To continue a graphical element beyond the outline of the scrap it belongs to, it must have the option “-clip off”.
join has two options:
- smooth can be “on” or “off”. It defines whether the line join should be smoothed or not.
- count, which is followed by a number, specifies the number of connections for a scrap “join”.
equate (.th command)
equate.
Identifies two (or more) station names. See survex for more details.
map (.th command)
break (.th command)
map.
A map is a collection of scraps or maps (you cannot mix them together). It can include a survey (the centerline will be displayed with the map). This command specifies as assemble of scraps (or maps) and surveys. The “map” command is multiline,
    map id [opzioni]
       <ids of scraps or maps>     <--- level 0
       break
       <ids of scraps or maps>     <--- level 1
       preview <above|below> another_map
    endmap
The break command splits the map on different levels. It is not possible to mix together ids of scraps and ids of maps: only one type can be used. The map is drawn in the output starting with the lowest level, therefore the scrap at level “1” are covered by those at level “0”. The preview command includes the outline of another map.
The map command has options:
- title specifies the title of the map;
- proj specifies the projection type. It can be “none” (cross-sections), “plan”, “extended” (extended elevation), and “elevation” (vertical projection).
surface (.th command)
surface.
This is a multiline command, used to include surface topography data. These can be given as a bitmap file, or as grid of altitudes. Therefore there are two possible syntaxes. In the first case you must provide the filename and its relation to the cave map,
    surface
      bitmap file_name calibration
    endsurface
where the calibration connects two points in the file (expressed as X-Y pairs in pixel units, with the origin (0,0) at the lower-left corner) to two points in the drawing, expressed as x-y in meters, or as station names. Therefore the syntax is
     X1 Y1 x1 y1 X2 Y2 x2 y2
 \br
     X1 Y1 station_1 X2 Y2 station_2
In the second case you must specify parameters of the grid and provide its data,
    surface
       grid-units units
       grid origin_x origin_y step_x step_y size_x size_y
       grid-flip [none|vertical|horizontal]
       data_of_the_grid
    endsurface
In this case the origin is the lower-left corner of the grid. The step is the dimension of the grid-cells, and the size is the number of grid nodes on the rows (x) and on the columns (y). The grid data are the altitudes (above sea level, in meters) at the nodes of the grid. They must be written by rows (from the west to the east), scanning the rows from the bottom (south) to the top (north).
import (.th command)
import.
This command is used to import survey data in an external format, “3d”, “plt” or “xyz”.
grade (.th command)
grade.
This command defines the grade, i.e., the accuracy, of the survey.
TODO an example and explain more.
revise (.th command)
revise.
This command is used to redefine properties of an object. It can be single-line, eg, “revise id -option1 value1 -option2 value2 …” or multiline, terminated by the command endrevise.
TODO an example and explain more.
2.C "therion"
therion is not a graphical program and can be executed from a shell (a command line prompt). The syntax is > therion [options] configuration_file
By default the configuration file is thconfig. For instance xtherion invokes therion with the command “therion -x thconfig”.
therion has several options (these can be given in long form too):
- -v: displays the version of the program;
- -h: (help) writes a short summary of the command options;
- -d: activates the debug mode;
- -g: generates a new configuration file;
- -u: update the configuration file;
- -l log_file: writes the logs on log_file;
- -L: does not generates any log;
- -q: (quiet) executes with fewer messages;
- -i: ingores the comments when writing a configuration file;
- -x: generates the file .xth-thconfig with the info for
xtherion - -p path: specifies the search path
- -s file: specifies a source file.
There are also options to display the configuration:
- –print-encodings
- –print-tex-encoding
- –print-init-file
- –print-environment
2.D Survex syntax
This section summarizes the synatx of survex datafile. See 1 for more details.
Survex datafiles are text files with command lines and data lines. A command line begins with a keyword, a word which starts with an asterisk “*”. The data lines contain the survey data. Comments are supported. A comment begins with a semicolon, ';', and goes to the end of the line. Furthermore extra data on a data line are ignored.
Station names are referred in a namespace in which the left entry is the most general, and the right entry is the name of the station. For example, lost_cave.main_passage.14 is the full name of the station “ 14” in the survey “ main_passage” of the cave “ lost_cave”.
A survex datafile starts with a “*begin <survey_name >” command and ends with a “*end <survey_name >” command. Both commands take the name of the survey, which must be the same.
Here are some survex commands.
- *data. It specifies the order of the survey data on the data lines that follow. For example, *data normal from to length clino compass states that the data have normal style, and you have to insert the survey data in the following order: from_station, to_station, distance, inclination, and compass measurements. A data line following this command might look like 1 2 4.30 17 217: this is the shot 1-2 of 4.3 meters, 17 of inclination, and 217 north
- *entrance states that a station is an entrance. For example *entrance 1 states that station “ 1” is a cave entrance.
- *equate defines the equivalence of two stations (possibly from different surveys). For example *equate 1 main_passage.14 defines that the station “ 14” of the survey “ main_passages” coincides with the station “ 1” of the current survey.
- *include is used to include other survex datafiles. For example “*include main_passage.svx” includes the survex data file
main_passage.sxv. - *export lists the stations referable from other surveys. For example, survey “ main_passage” should have the command “ *export 14” to make the station “ 14” referable in an “*equate” command of other surveys. Or the global datafile can have the command “*export main_passage.14” before (or after?) including the datafile of the survey “ main_passage”.
- *fix specifies the geographical coordinates of a station. For example “*fix 1 …” TODO
- *units specifies the units used for a measure. For example, *units length 0.01 meter states that lengths are expressed in units of centimeters (0.01 m). Another example: *units compass grad states that compass readings are in centesimal degrees.
- *team specifies the name of a survey team member, and optionally his/her roles. For example. “*team xyz compass clino” states that “xyz” was at the compass and clino readings.
Here is a simple example, the first survey file of the sample cave used in this chapter. Only the first few data lines have been included. Notice the “*export” command, that makes the station “24” available to join with other surveys.
 *begin gm-01
 *export 24
 *data normal from to tape compass clino ignoreall
 *units length metres
 *calibrate tape 0.0
 *units compass degrees
 *calibrate compass 0.0
 *units clino degrees
 *calibrate clino 0.0
 ;end generated presettings

 *units length metres
 *title "Grazie Mille"
 *team "L. Aimar" compass clino
 *team "A. Premazzi" notes pictures
 *team "S. Vandone" tape
 *team "A. Venturini" tape

 ; Cap 1 = ingresso
 *entrance 1

 *data normal from to length clino compass
 1 2    5.70   -52   190
 2 3    6.50   -50   205
 3 4    2.80   -90     0
 4 5    3.65   -50   193
 5 6    4.35   -33   228
 ...

 *end gm-01
Here is the global survex file that includes the three survey files and joins the surveys with “*equate” commands:
 *begin gm

 *data normal from to tape compass clino ignoreall
 *units length metres
 *calibrate tape 0.0
 *units compass degrees
 *calibrate compass 0.0
 *units clino degrees
 *calibrate clino 0.0
 ;end generated presettings

 *equate gm-01.24 gm-02.1
 *equate gm-02.13 gm.03.1

 *include gm-01/gm-01.svx
 *include gm-02/gm-02.svx
 *include gm-03/gm-03.svx

 *end gm
