Table of Contents
What do Therion’s Outputs Look Like?
If like me you haven't had much experience with other than txt and pdf files, some of the other output formats can be a bit hard to fathom. Like why don't all my drawing symbols show up in dxf and esri files? In some cases it might be because the format does not easily support such niceties, and in others, well perhaps Therion’s development has not extended that far yet.
And also, what general characteristics do these other output formats have?
Someone else might like to add some better explanations. For now, as a taster, I'll just add some screen shots of one part of a cave I have been working on.
If you want a better explanation of what data is exported to which type of format of map or model, then there is some discussion on the Export Selection and Formats page
The examples below are from a section of cave dataset with maps defined for about 13.6km of passage, and surveys of about 24km of passage. So the map outputs represent 13.6km of passage, and the survey (model) outputs represent 24km of passage. I have indicated the file size for each type of output, so you can get a feel for how efficient, or not, the format is.
My personal favourites (most used) are map and atlas pdfs for cartographed presentations, Survex's 3d viewed in Aven for fast efficient interrogation and help with debugging, the lists for viewing survey statistics and tracking continuations (exploration leads) and Google Earth's kml for distributing a rough and ready plain georeferenced representation. Oh, and Loch is quite nice, lots of features, if a little cumbersome… And the xvi's get used every time I produce a drawing of course, given I'm sold on PocketTopo's paperless workflow.
MAPS
These examples are all plan projection maps, but many of the map output formats support elevation and extended projections. Not sure if an elevation in Google Earth is particularly relevant. Something to try!
MAP PDF
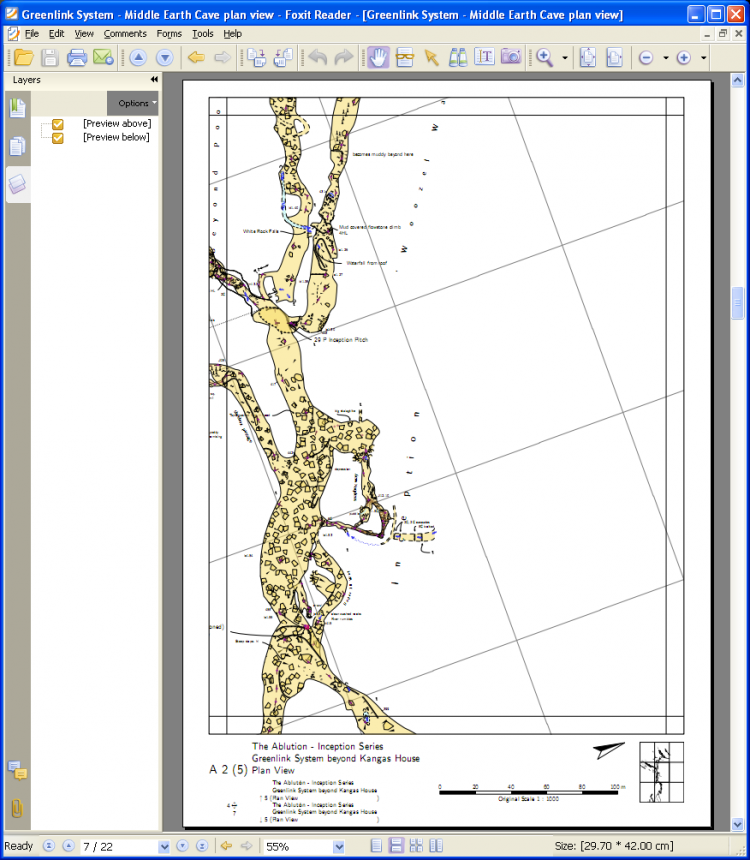
This cartographed pdf plan view is about 7.3MB in size, and this example is comprised of two defined maps that are each plotted on their own layer. You can show and hide the layers at will in most pdf viewers. You can include a surface image, it will be placed on its own layer, and the file size will increase by about the size of the image
export map -projection plan \
     -layout LayoutMapThisCave   \
     -layout LayoutMapThisCavePlan   \
     -output ../Output/MiddleEarthPlan.pdf
If you would like to force a map output to a particular size or proportion see how_to_make_map_outputs_match_iso_paper_size_proportions
ATLAS PDF
An atlas is not really a map, but it is pretty close, so I have included it here. The file is 4.6MB. They are exactly the same as the map outputs, except that the atlas is cut up to fit a page size that you specify and it contains hyperlinks at page edges, the navigation panel and between layers.
export atlas -projection plan   \
     -layout LayoutAtlasThisCave   \
     -layout LayoutAtlasThisCavePlan   \
     -output ../Output/MiddleEarthPlanAtlas.pdf
MAP SVG
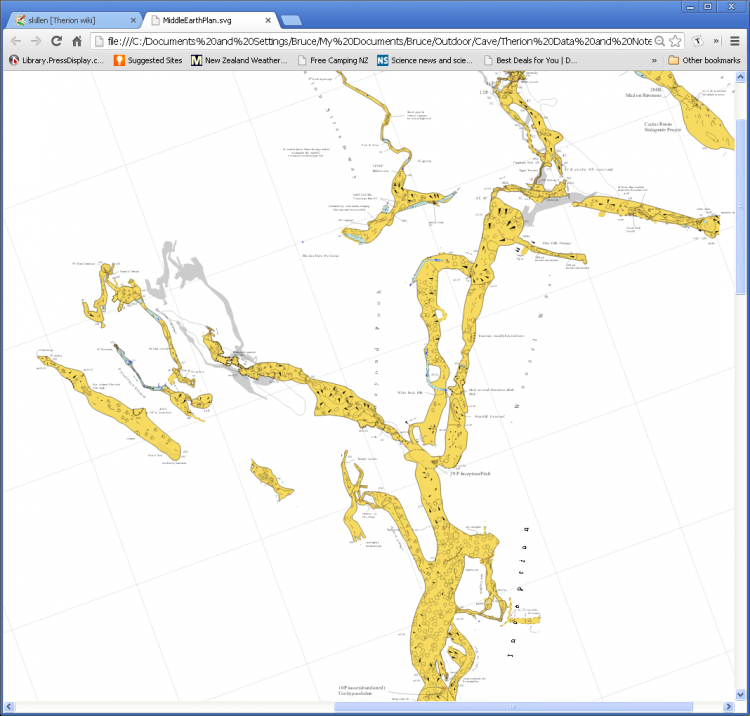
This one is 8.5MB. I’ve never had much fun with svg files. At this size they take forever to load. The graphics render nicely, but the text is not so good. No title blocks, map connections are not drawn. Maybe someone who knows something about svg and how to view them could say something constructive here?
export map -projection plan \
     -layout LayoutMapThisCave   \
     -layout LayoutMapThisCavePlan   \
     -output ../Output/MiddleEarthPlan.svg
MAP XHTML
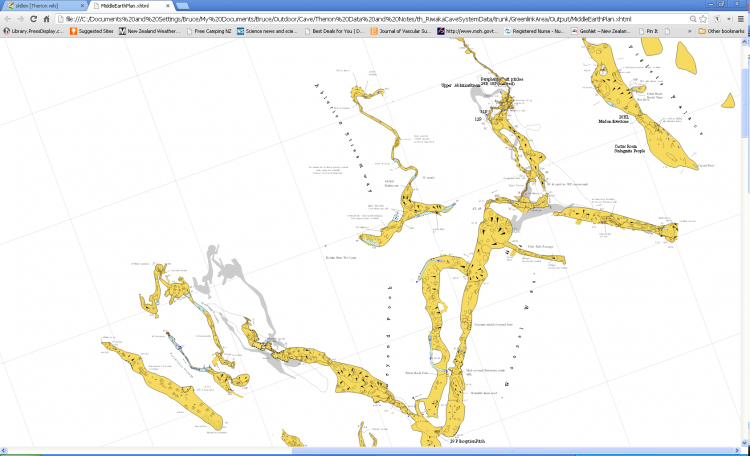
8.7MB. Much like svg. Clunky and slow to load, but does include a header and legend, sort of. Does not seem to follow the instructions in the layout files.
export map -projection plan \
     -layout LayoutMapThisCave   \
     -layout LayoutMapThisCavePlan   \
     -output ../Output/MiddleEarthPlan.xhtml
MAP XVI (Therion)
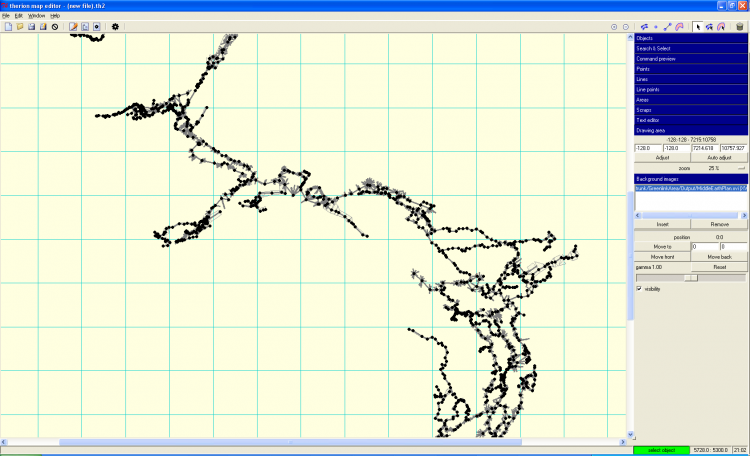
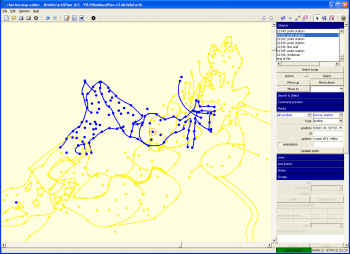
Therions own format. Is 2d and can include background images. Not really intended as a final output in itself, but as an intermediate stage to getting the drawings done, scrap by scrap. So this is a bit of an artificial example. For realistic uses it is pretty quick, but this unreasonable output of most of the cave at 1.4MB was pretty darn slow to load.
export map -projection plan \
     -output ../Output/MiddleEarthPlan.xvi
Despite this export being a ‘map’, in fact a model was produced.
MAP TH2 (Therion)
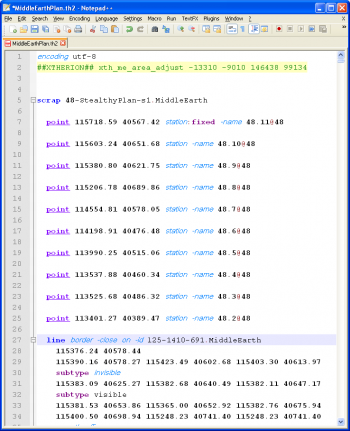
An undocumented feature! Exporting to th2 and coordinate compatible xvi! Thanks to Xavier Pennec for pointing this out http://article.gmane.org/gmane.comp.gis.therion/4716
A way to synchronise scale, rotation and coordinates of an image with an existing scrap (th2).
File size for this example, 2.9MB. Again, horrendously slow to load this whole cave 98,000 line example output into XTherion, although again, realistic uses of this output would be for one or two survey trips.
Even though only two maps were selected for th2 export (as with all map examples on this page), all of the maps in the source files were exported to th2 (The xvi produced is constrained to the selected maps however). And as Xavier describes, not all of the properties of the drawing objects are reproduced in exported th2. You will need to manually transcribe missing details to the new th2 file.
layout Layout-th2
  scale 1 100
  grid-size 1 1 1  m
  sketches on  ## so that rewarped sketches are included in exported in th2
endlayout
export map -projection plan \
     -format th2 \
     -layout Layout-th2 \
     -output ../Output/MiddleEarthPlan.th2
export map -projection plan \
     -format xvi \
     -layout Layout-th2 \
     -output ../Output/MiddleEarthPlan.xvi
You would perform this transformation only on a few scraps, not a whole cave!
Probably most useful where you have;
- just created a scrap or two, without too much detail other than stations and walls, and
- added some background images, such as an xvi import from Pockettopo, and added these as background sketches to the appropriate scraps, and
- you have another background image file (with stations drawn on it) that you would like to insert into the file and warp over your existing scraps.
You cannot do this directly with XTherion, so you would create a new th2 file for your new image file, add station points to it, then merge the two using a layout and exports similar top those above, thus creating a brand new combination th2 file.
I haven't actually carried this process all the way through, so this description may not be accurate…
ie The th2 looks like any other th2 file. The above are not very good examples - need one that shows just a few scraps with xvi and hand drawn images…
MAP 3D (Aven-Survex)
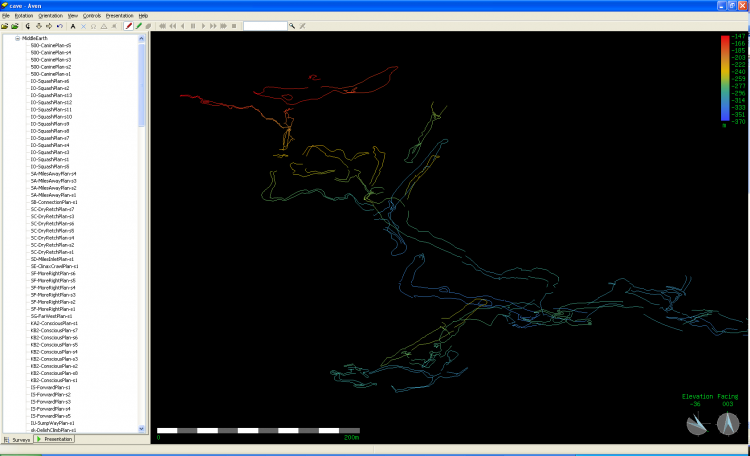
Hey! Scrap outlines in 3d with Survex’s Aven viewer. 1MB, so quite compact. Fast to load. Excellent interactive display of map and scrap drawing hierarchy on the left and can display the names of scraps on the ‘model’. Can turn on the centrelines as well. Much easier than using ‘debug’ in layouts to get the same information out of a pdf. The ends of the scraps don’t join nicely in the z dimension, but that is a small price to pay for the usefulness of this output when you are deciphering how your drawings are put together. Works nicely for elevations as well as plan views.
export map -projection plan \
   -output ../Output/MiddleEarthPlan.3d
MAP KML (Google Earth)
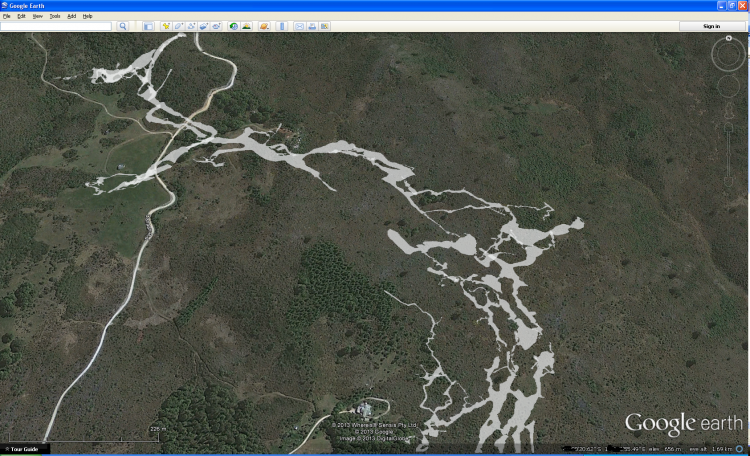
Google Earth format. This 3.8MB. These scrap outlines are all drawn at their actual 3d elevations, but if you change the default property from ‘clamped to ground’ to ‘absolute’ they disappear because the free Google Earth does not allow translucent ground, and does not allow the 3d terrain to be turned off (one used to be able to view ones cave in true 3d in mid-air if the terrain was turned off).
export map -projection plan          \
     -output ../Output/MiddleEarthPlan.kml
MAP DXF
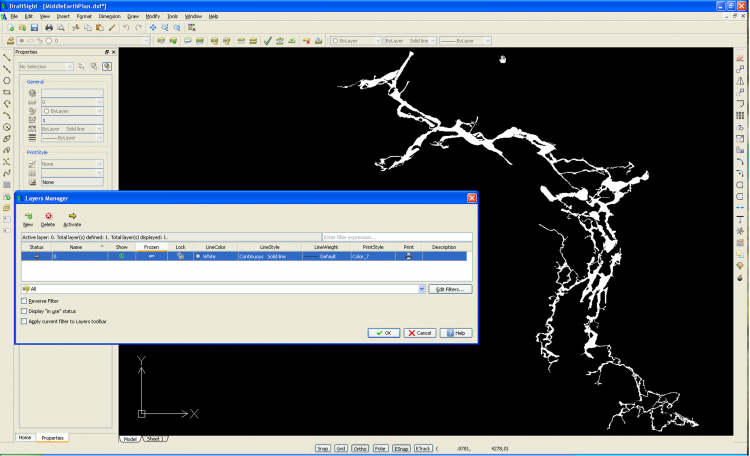
These are just a single 2d shapes that match scraps you have drawn. One layer only as far as I can tell. This one is about 9.7MB.
export map -projection plan \
   -output ../Output/MiddleEarthPlan.dxf
MAP ESRI (ArcMap)
A folder of the name specified is created by Therion, and twelve files are placed in it, 16.5MB all up. dbf, shp and shx for each of points, lines, areas and passage outlines. Only the outline shape file is of immediate use, the others are not symbolised. The outline files are 3.8MB in total. Cave Surveying Group site.
export map -projection plan \
  -output ../Output/MiddleEarthGISPlan  \
  -format esri  # format statement explicitly required else pdf is produced regardless of extension
MAP BBOX
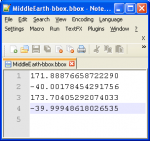
This 'map' is all of 1kB in size, and defines a bounding box with decimal lat-long coordinates, bottom left and top right corners.
export map -output ../Output/MiddleEarth-bbox.bbox
MODELS
MODEL LOX (Loch-Therion)
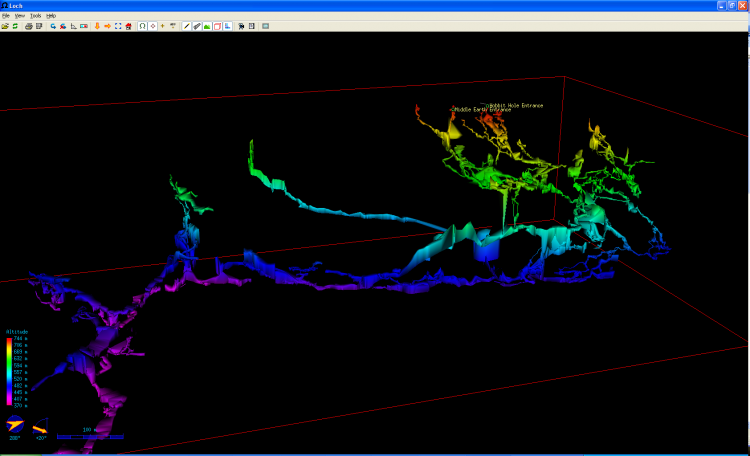
Therions own model viewer. 5.2MB. If the surface image is exported, the file size increases by about the size of the image. Can take a long time to generate and a long time to open the file (particularly with surface grid and images). The best viewer for integrating cave model with surface model and image.
Some examples of how scrap drawings and LRUD data affects the models are here
export model -output ../Output/MiddleEarth3DModel.lox
MODEL 3D (Aven-Survex)
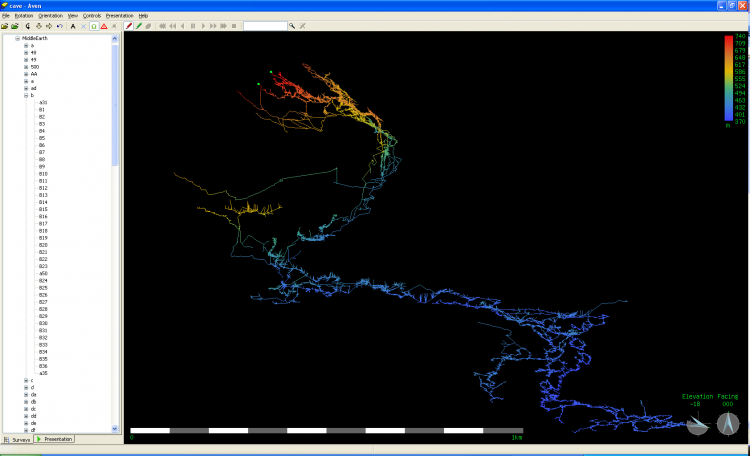
The 3d output is designed for Survex’s Aven viewer. This output is very compact and fast to create and view. This file is 0.5MB. The survey structure is easy to view and interrogate. You can graphically find the distance from any station to any other station. Entrances and fixed points can be highlighted. It’s so fast, useful and error tolerant I always create these. Passage shape, survey dates etc are not exported to this format.
export model -output ../Output/MiddleEarth3DModel.3d
MODEL DXF
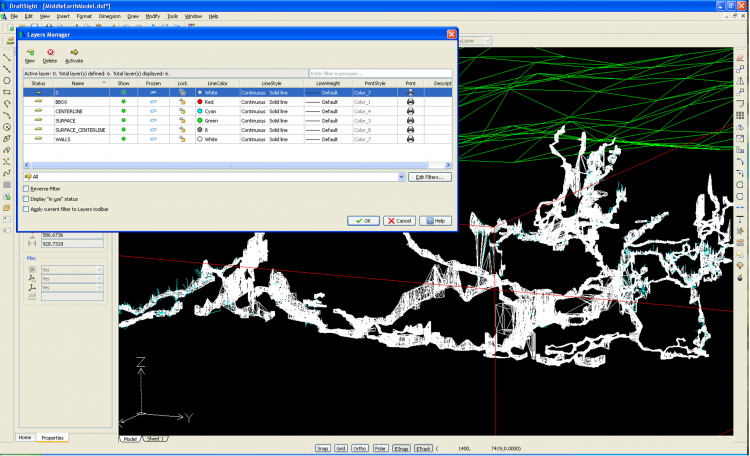
This is a 3d model with surface grid that you can spin and zoom around in. Each type of entity is on a different layer. This one is about 30MB.
export model -output ../Output/MiddleEarthModel.dxf
MODEL KML (Google Earth)
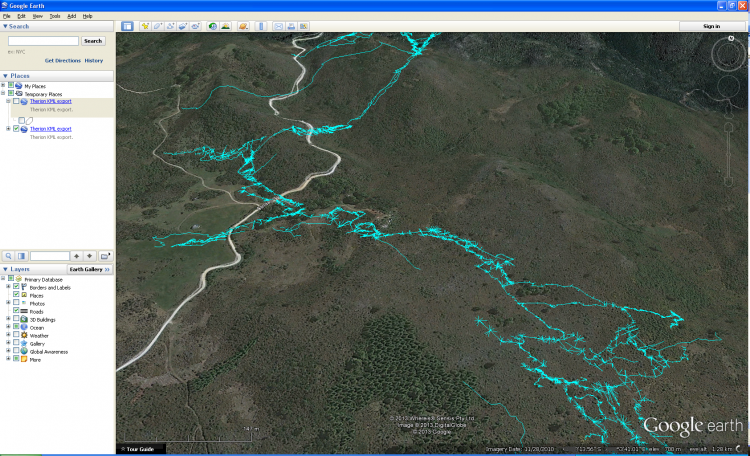
Google Earth model, 3.1MB. Same characteristics as the map wrt the model disappearing underground if you enable the absolute at coordinates in Google Earth.
export model \
  -output ../Output/MiddleEarth3DModel.kml
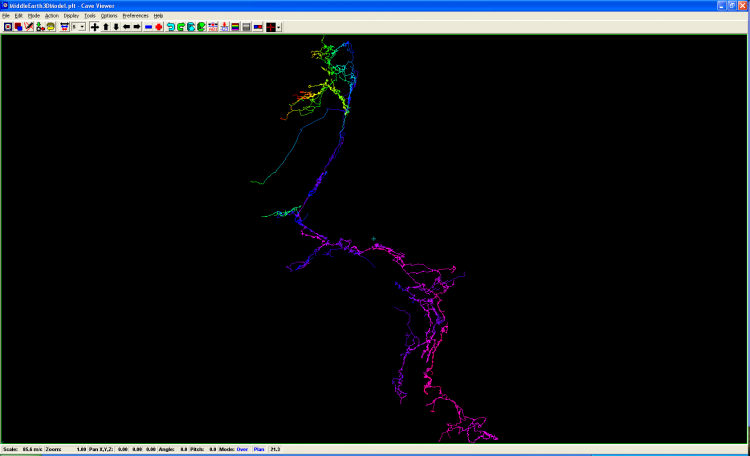
MODEL PLT (Compass)
MODEL ESRI (ArcMap)
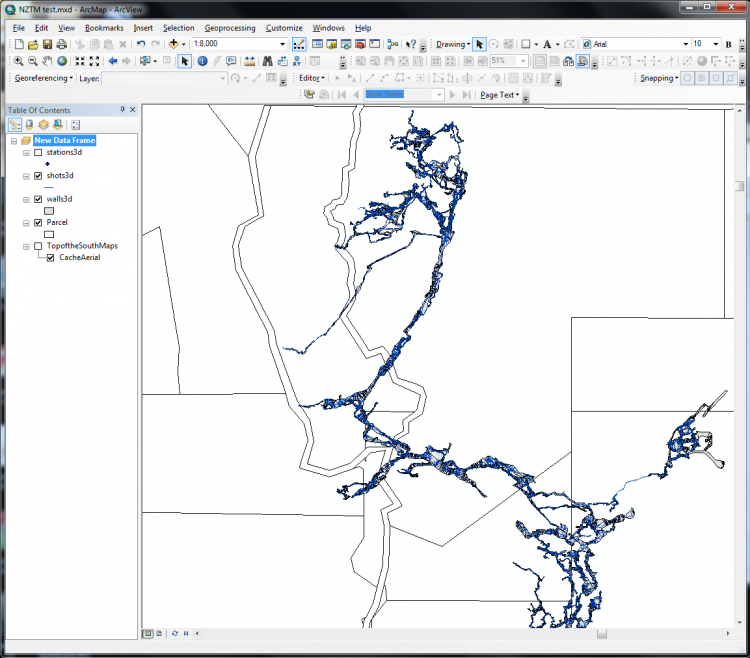
A folder of the name specified is created by Therion, and nine files are placed in it, 14.3 MB all up. dbf, shp and shx for each of shots, stations and walls. A good description is provided on the Cave Surveying Group site.
export model \
  -output ../Output/MiddleEarthGISModel  \
  -format esri  # format statement explicitly required else pdf is produced regardless of extension
MODEL VRML
This one is 7.4MB. I'm scratching around looking for a viewer - any suggestions?
export model -output ../Output/MiddleEarth3DModel.vrml
List of available VRLM viewers: http://cic.nist.gov/vrml/vbdetect.html
<to do: add image>
MODEL 3DMF
This one is 6.0MB I'm scratching around looking for a viewer - any suggestions?
export model -output ../Output/MiddleEarth3DModel.3dmf
MacOSX:
Windows:
Linux:
- http://automagically.de/g3dviewer/ (but the last update is from year 2009)
There is/was a multiplatform project Quesa on sourceforge.net, but the last update is from year 2000.
<to do: add image>
DATABASE
DATABASE CSV
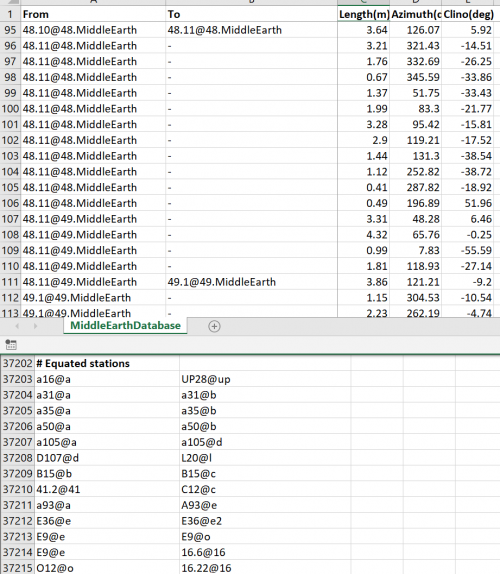
The csv database format is a comma delimited text file, readily loaded into the likes of an Excel spreadsheet. It contains a list of survey shots (legs and splays) followed by a list of equated stations. 1.0MB
export database -output ../Output/MiddleEarthDatabase.csv
DATABASE SQL
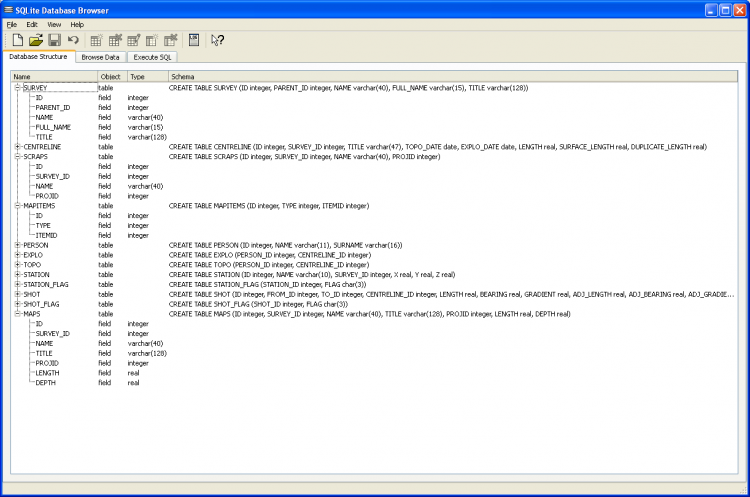
The database contains contains all the survey data and metadata. It does not give you a model or picture of the cave in the same way as the above, although you can get graphic representations like this 
if you hook it up to some other wizardry (web interface for querying sql database) 4.2MB
Therion 5.3.11 has introduced map information to the database, in the form of scrap, map-item and map tables.
export database -output ../Output/MiddleEarthDatabase.sql
or as a more easily readable table:
| CENTRELINE | PERSON | EXPLO | TOPO | STATION | STATION_FLAG |
|---|---|---|---|---|---|
| ID | ID | PERSON_ID | PERSON_ID | ID | STATION_ID |
| SURVEY_ID | NAME | CENTRELINE_ID | CENTRELINE_ID | NAME | FLAG |
| TITLE | SURNAME | SURVEY_ID (X real, Y real, Z real) | |||
| TOPO_DATE | |||||
| EXPLO_DATE | |||||
| LENGTH | |||||
| SURFACE_LENGTH | |||||
| DUPLICATE_LENGTH |
| SHOT | SHOT_FLAG | MAPS | SCRAPS | MAPITEMS |
|---|---|---|---|---|
| ID | SHOT_ID | ID | ID | ID |
| FROM_ID | FLAG | SURVEY_ID | SURVEY_ID | TYPE |
| TO_ID | NAME | NAME | ITEMID | |
| CENTRELINE_ID | TITLE | PROJID | ||
| LENGTH | PROJID | |||
| BEARING | LENGTH | |||
| GRADIENT | DEPTH | |||
| ADJ_LENGTH | ||||
| ADJ_BEARING | ||||
| ADJ_GRADIENT | ||||
| ERR_LENGTH | ||||
| ERR_BEARING | ||||
| ERR_GRADIENT |
LISTS
I'll only add a couple of list formats here, as I'm hoping the generally textual formats the others come in are not too much of a mystery.
CAVE-LIST (KML, HTML)
Refer to the FAQ page - main entrance definition
Cave-list outputs also echo the user defined attributes specified with station command-like option, similarly to the continuation-list outputs.
CONTINUATION-LIST (html)
The idea of continuation list generation came from very useful on-line documentation used by CUCC project in the Totesgebirge (maybe by others too): Hauchhöhle Question Mark list and description of continuations. This is a good way to manage all the unexplored leads (possible continuations) existing in a cave. One may plan the next expedition to investigate each of the continuations.
Check ThBook page 94 (version 5.3.11).
Using 'export continuation-list' you get an overview of all points in the centreline and
scraps marked as a possible continuation. Currently the following output formats are supported: html (default), txt and dbf.
The continuation flag can be part of the station definition in a survey centreline, and can include user defined attributes
station 5 "pit to explore" continuation attr Code V explored 20m
or as part of a drawing scrap
point continuation
  -text "pit to explore" -attr Code V -explored 20m
In this example 'Code' is the user defined attribute, and 'V' is the user defined value of 'Code'. For another example of how you might use this see 'point continuation' on this page (scroll down to point continuation).
export continuation-list -o output/klisura_continuations.html
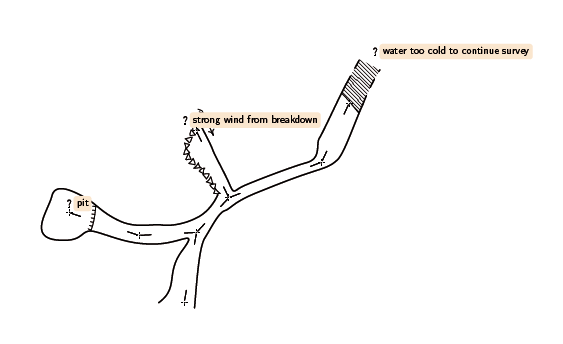
When you redefine the continuation symbol as mentioned below, you can expand on the default behaviour that shows only a question mark, to show the continuation codes and descriptions in exported maps.
code metapost
  def p_continuation(expr pos,theta,sc,al) =
    % draw default continuation symbol
    p_continuation_UIS(pos,theta,sc,al);
    % if text attribute is set
    if known(ATTR__text) and picture(ATTR__text):
    % set labeling color to light orange
    push_label_fill_color(1.0, 0.9, 0.8);
    % draw filled label with text next to ?
    p_label.urt(ATTR__text,(.5u,-.25u) transformed T,0.0,8);
    % restore original labeling color
    pop_label_fill_color;
    fi;
  enddef;
endcode

