This is an old revision of the document!
Please, feel free to add your own examples of your interesting solutions made with therion.
Sample Datasets
All Areas, All Symbol Sets
This sample dataset produces eight A3 approx maps at 1:1000 in a single run. If you uncomment the LayoutStandard and other layouts you can see the effect of overlying some customisations to the built in symbol sets, or relatively easily add your own customisations.
If you typically use other scales, then, to maintain the A3 size of the page, you will need to appropriately factor the station coordinates set by the fix statements in the file Areas.th
The attached includes an example output with customised symbols, however the files as currently set up in this archive will produce reasonably standard outputs for the 8 built-in symbol sets.
A comment on differences between viewers for_pdf_files
Maps and Layouts
Layouts affect only two dimensional, or map outputs. Three dimensional outputs, or models, are unaffected by layouts. Maybe, in the sections below, the distinction has been blurred, and should perhaps be rearranged to distinguish between surveys, maps, map outputs and model outputs. I'm not sure? Perhaps that is a project for another day…
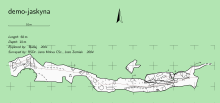
source .th file - "demo-cave.th"
  survey demo-jaskyna

  input demo-jaskyna.th2

  map vrch

    demo-jaskyna_s1
    break
    demo-jaskyna_s2
    endmap

  centerline

    units compass grads
    units clino grads
    units tape metres

    team "RSDr. Jano/Mrkva CSc." #there are more than two strings in a name
    team "Jozo Zemiak"

    explo-team "Budaj"
    explo-date 2001.12.04

    date 2004.11.20

    data normal from to    length  compass   clino

           0         1      7.69    188        99
           1         2      4.54     75         2
           2         3      2.72    153         6
           3         4      1.89    112        32
           4         5      4.5     105         5
           5         6      3.6     109       -20
           6         7      3.36    104         7
           7         8      4.89    145        22
           8         9      3.2      90        -2
           9        10      7.67    108       -11
          10        11      7.05     90        -1
          11        12      3.68     81        10
          12        13      2.39     94        31
          12        14      2.83     23        -1
          11        15      3.85    338       -51
          15        16      4.44     98       -16

    endcenterline

  endsurvey
Only centerline
Note - the survey “demo-jaskyna” is a part of survey “centerline” now and there is a new map definition
survey centerline -title "Demo cave - only centerline"

  #input demo-jaskyna.th2    #no any .th2 file necessary

  map vrch -projection plan  #the "-projection" option must be here
    demo-jaskyna             #this is the survey, not a scrap
    #demo-jaskyna_s1
    #break
    #demo-jaskyna_s2
  endmap

  survey demo-jaskyna

    #map vrch
      #demo-jaskyna_s1
      #break
      #demo-jaskyna_s2
    #endmap

    centerline

       ....

    endcenterline

  endsurvey demo-jaskyna
endsurvey centerline
The default centerline you may change to colored solid line with help of piece of Metapost code in layout section of thconfig file:
code metapost

def l_survey_cave (expr p) =
  draw p withpen PenD withcolor (0.1,0.3,0.1);
enddef;
 Click on image to see the full resolution file
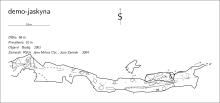
3D export - vrml, map export - different language, legend off
source demo-jaskyna

#export model -fmt 3dmf
#export model -fmt survex
#export model -fmt compass
export model -fmt vrml

layout demo-jaskyna-header

  map-header 0 100 sw

  #language cz
  language sk
  #language en
  #language fr

  legend off

  #colour map-fg [80 80 80]
  #colour map-bg [70 90 70]
  #symbol-hide group all
  #symbol-show line wall
  #symbol-show line survey

  transparency on
  opacity 60

  statistics topo-length off #on
  statistics explo-length off #on

  #code metapost
  #def l_survey_cave (expr p) =
    #draw p withpen PenD withcolor (0.5,0.3,0.3);
  #enddef;

endlayout

select vrch@demo-jaskyna

export map -layout demo-jaskyna-header -output cave_00.pdf
 Click on picture to see original size
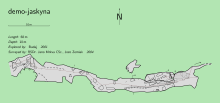
No 3D export, map export - colored background and foreground, colored surveying lines, no legend
source demo-jaskyna

layout demo-jaskyna-header

  map-header 0 100 sw

  legend off

  colour map-fg [80 80 80]
  colour map-bg [70 90 70]

  code metapost

  def l_survey_cave (expr p) =
    draw p withpen PenD withcolor (0.5,0.3,0.3);
  enddef;

endlayout

export map -layout demo-jaskyna-header -output cave_01.pdf
 Click on picture to see original size
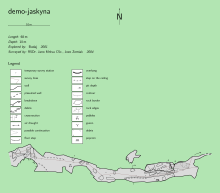
Map export - legend on, colored foreground, background and surveying line
source demo-jaskyna

layout demo-jaskyna-header

  map-header 0 100 sw

  legend on #off

  colour map-fg [80 80 80]
  colour map-bg [70 90 70]

  code metapost

  def l_survey_cave (expr p) =
    draw p withpen PenD withcolor (0.5,0.3,0.3);
  enddef;

endlayout

export map -layout demo-jaskyna-header -output cave_02.pdf
 Click on picture to see original size
Map export - another language, header in bottom left corner, legend off, colored foreground and surveying line
source demo-jaskyna

layout demo-jaskyna-header

  map-header 0 0 nw

  #language cz
  #language sk
  #language en
  language fr

  legend off #on

  colour map-fg [80 80 80]
  #colour map-bg [70 90 70]
  symbol-hide group all
  symbol-show line wall
  symbol-show line survey

  code metapost

  def l_survey_cave (expr p) =
    draw p withpen PenD withcolor (0,0,1);
  enddef;

endlayout

export map -layout demo-jaskyna-header -output cave_03.pdf
 Click on picture to see original size
Map export - map header off, legend off, colored foreground, only walls
source demo-jaskyna
#export model -fmt 3dmf
#export model -fmt survex
#export model -fmt compass
#export model -fmt vrml

layout demo-jaskyna-header

  #map-header 0 0 nw
  map-header 0 0 off

  #language cz
  #language sk
  #language en
  #language fr

  legend off
  #legend on

  colour map-fg [10 10 10]
  #colour map-bg [70 90 70]

  symbol-hide group all
  symbol-show line wall
  #symbol-show line survey

  opacity 70

code metapost

def l_survey_cave (expr p) =
  draw p withpen PenD withcolor (0,0,1);
enddef;

endlayout

select vrch@demo-jaskyna

export map -layout demo-jaskyna-header -output cave_04.pdf
 Click on picture to see original size
Map export - colored background, only walls
source demo-jaskyna

layout demo-jaskyna-header

  #map-header 0 0 nw
  map-header 0 0 off

  legend off
  #legend on

  #colour map-fg [10 10 10]
  colour map-bg [70 70 70]
  symbol-hide group all
  symbol-show line wall
  #symbol-show line survey

endlayout

select vrch@demo-jaskyna

export map -layout demo-jaskyna-header -output cave_05.pdf
 Click on picture to see original size
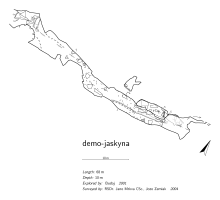
Map export - default layout, rotated map
Note: the profile is not rotated
source demo-jaskyna

layout demo-jaskyna-header

  rotate 30

export map -layout demo-jaskyna-header -output cave_06.pdf
 Click on picture to see original size
Map export - grid, colored background and foreground
source demo-jaskyna

layout demo-jaskyna-header

  map-header 0 100 sw

  grid bottom

  grid-size 5 5 5 m

  colour map-fg [80 80 80]
  colour map-bg [70 90 70]

endlayout

select vrch@demo-jaskyna

export map -layout demo-jaskyna-header -output cave_07.pdf
 Click on picture to see original size
Cachtice cave - example of quite complicated map
made by Martin Sluka
![]() Click on picture to see original size
Click on picture to see original size
Colour Scales - Lookups
Therion Development 5.4.1+4369eea (late 2017) introduced a new concept, lookups, to control colour palettes for map and atlas outputs.
Original forum post advising of this change
Whether or not you use lookups, you can specify the parameter that is depicted in colouring of 2D outputs. You specify this in a layout. eg, use one of…
colour map-fg [100 0 0] # hard writes a single colour to entire output
colour map-fg altitude
colour map-fg explo-date
colour map-fg topo-date
colour map-fg map
colour map-fg scrap
If you have created one or more lookups for a particular parameter, you can specify which one to use, by specifying an index. ie
colour map-fg altitude:banded
To see the colour legend in your map header, you will need to turn it on;
colour-legend on
You can also specify the colouring in an export statement directly, without defining a layout. eg
export map -layout-color map-fg topo-date
If you do not specify a lookup, for altitude or dates, the range of values in the output is divided into 7 legend entries.
If you do not specify a lookup for map and scrap, all of the maps or scraps are listed. Depending on how your map definitions are set up, specifying the map-level when you select maps for output may affect the number of maps that appear in the colour legend and are coloured.
select MyCavePlanMap -map-level 1
By default altitudes are sorted highest, red [100 0 0] to the top of the list, and magenta [100 0 100] to the bottom.
By default dates are sorted most recent, red to the bottom of the list, oldest, magenta, to the top of the list, and undated surveys are uncoloured.
Form of lookup
Lookups are defined in a thconfig, or at least outside of of any survey or layout definitions.
They take the form…
lookup [altitude | explo-date | topo-date | map | scrap][:index] [-title "custom title text"]
 # now list parameters, optional colours, optional text overides to appear in each legend entry, as in the examples below
 # do not specify any colours if you want Therion to use it's default colour palette
endlookup
lookup altitude examples
lookup altitude -title "Altitude legend"
 700 [100 0 0] "700 m a.s.l."
 680
 660
 640
 620
 600 [0 0 100] "below 600 m"
endlookup
It should generate red → blue scale with desired values.
You may specify multiple lookup tables for same criterion using an index, ie “:” separator in label
lookup altitude:scale1
 600
 800
endlookup
and
lookup altitude:scale2
 800
 750
 700
endlookup
and use then
color map-fg altitude:scale1
or
color map-fg altitude:scale2
Also intervals, or bands, should work:
lookup altitude:banded
 [1500 1600] [] "cave floor 1" #If the text is omitted, then the default will display the range, ie 1600 m - 1500 m
 [1800 1900] [] "cave floor 2"
endlookup
This will produce a single colour for passage between 1500 and 1600 m and between 1800 and 1900 m, and leave all other passage, above, in between, and below, uncoloured.
lookup date examples
lookup topo-date
 2010.12.31 [] "2010 and before"
 2011.12.31 [] 2011
 2012.12.31 [] 2012
 - [] "2013 and later"  #my experimentation suggests that '-' colours undated surveys if last in the list, and all surveys if first in list.  Bruce
endlookup
lookup map and scrap examples
lookup map
 map1@some_survey [color]
 map2 [color]
 map3 [color]
endlookup
Same should work with scraps.
With maps you may specify colour of a particular map when selecting it your thconfig, without the need for a lookup
select map1 -color [100 0 0] # This does not work for me. Bruce
Make sure you don't have any 'colour map-fg' statements however, as if present they will override [I THINK]
Models
Export to 3D data (clouds) processing softwares
Therion is able to export 3D model in format .lox based on LRUD data, shape of walls in plan and passage height informations recently. If the map is drawn in correct way these models are quite good. To view the model one should use internal viewer of Therion named Loch. The Loch has feature to export model in the VTK format. And several softwares for manipulating with 3D data for example CloudCompare or Paraview are able to import this VTK format.
Take care that if there are fixed points with coordinates they are exported as very big numbers compared to altitude. In ParaView the data are OK, if you split window, select Spreadsheet View and set the precision of X and Y to 11 numbers. But export to MeshLab will not export them. I'm sure, there is possibility to subtract those big parts of X and Y but I don't know how. (Sluka 2015.10.29)
There is easy way to convert binary data to ASCII with help of ParaView. Just open .vtk file exported from Loch (binary) and save it from ParaView, but as .vtp ASCII file. It is XML and you may copy, change and replace points coordinates easy. (Sluka 2015.11.18.)
If you change one line in file lxData.cxx around line 615 and recompile loch, you'll receive after export to VTK ASCII file (thanks Stacho). It is easy to edit it. (Sluka 2015.11.09)
w->SetFileTypeToBinary(); to w->SetFileTypeToASCII();
CloudCompare is able to export next formats:
BIN .bin CloudCompare own format
ASCII .asc,.txt,.xyz,.neu,.pts ASCII point cloud file (X,Y,Z,etc.)
LAS .las ASPRS lidar point clouds
E57 .e57 ASTM E57 file format
PCD .pcd Point Cloud Library format
PLY .ply Stanford 3D geometry format (cloud or mesh)
OBJ .obj Wavefront mesh
VTK .vtk VTK file format (triangular mesh or cloud only)
STL .stl STereoLithography file format (mesh)
OFF .off Object File Format (mesh)
FBX .fbx Autodesk (Filmbox) File Format
DXF .dxf Autocad DXF format
SHP .shp ESRI Shape file format
RASTER .geotiff, etc. Common raster formats (GDAL)
PV .pv Point cloud + scalar field
PN .pn Point cloud + normals
Sinusx .sx Sinusx curves
ParaView is able to work with next formats:
ParaView files
VTK files
Parallel (partitioned) VTK files
VTK MultiBlock (MultiGroup, Hierarchical, Hierarchical Box) files
Legacy VTK files
Parallel (partitioned) legacy VTK files
EnSight files
EnSight Master Server files
Exodus files
BYU files
XDMF files
PLOT3D files
SpyPlot CTH files
HDF5 raw image data files
DEM files
VRML files
PLY Polygonal files
Protein Data Bank files
XMol Molecule files
Stereo Lithography files
Gaussian Cube files
Raw (binary) files
AVS files
Meta Image files
Facet files
PNG files
SAF files
LS-Dyna files
What is more: ParaView is able to export model to WebGL format which is possible to publish on your web pages.
Steps to calculate the volume and surface
thanks to Filippo Gregori
1) Export the lox file to vtk format
2) With Paraview software I opened the file vtk
3) Export scene as .x3d
4) Open the file x3d in Meshlab software
6) Apply the filter: Filters -> Quality measure and computation -> compute geometric Measures
7) Open log window: View -> Show Layer dialog
8) Read the lines Volume Mesh and Mesh Surface
Note: If you use coordinates for a fixed station as the result there are huge numbers for the X and Y coordinates compared to the altitude. ParaView is not able in the way described above to export scene to MeshLab correctly. I don't know a way to subtract those big parts of coordinates in ParaView till now, anyway it should be possible. Please, if somebody may help, do it.
Export to WebGL
WebGl is widely used for game creation for example. 3D objects could be covered by skins, camera may move inside of model and so on.
1) Export the lox file to vtk format
2) Open the file in ParaView
3) Export Scene as WebGL to an empty folder
4) Open the file xxx.html in a browser or publish code on your web page
Loch Models, Paperless survey, Plan scraps and LRUD
In this example there is a single centreline (comprising both cave and surface survey) and 4 scraps. Compiled with Therion 5.3.11, July 2013
A short section of cave at the left hand end does not have any scrap drawn.
One interesting point is that regardless of the ‘walls’ setting, there is never a tube generated the left hand end once we have scraps drawn anywhere in this centreline. My deduction is that Loch uses only one type of tube generation per centreline, because in almost all my larger projects that transition between traditional survey and paperless survey methods, I have a combination of each type of tube generation within the same Loch model.
This fits with the description in the Therion Book “walls <auto/on/off> turn on/off passage shape generation from LRUD data for subsequent shots. If set auto, passage is generated only if there is no scrap referencing given centreline.”
In these examples I have not used any ‘point passage-height’ or ‘point dimensions’ in the scraps.
, walls auto, off or on (or not specified), No plan scraps. Same if LRUD present and walls off.")
Paperless survey (no LRUD), walls auto, off or on (or not specified), No plan scraps. Same if LRUD present and walls off.
In this case Loch always guesses tube dimensions.
, walls auto, off or on (or not specified), plan scraps drawn.")
Paperless survey (no LRUD), walls auto, off or on (or not specified), plan scraps drawn.
In this case Loch uses scraps exactly as drawn for tube width and guesses tube height
Now, I added a few LRUD to the same centreline, including some with only UD, and using extra large or small numbers, so the effects can be readily observed.
data dimensions station left right up down
1.4 - - 20 20 #right hand end of picture
1.5 - - 20 20
1.6 2 2 20 20
3.13 10 10 20 20
3.14 10 10 20 20 #left hand end of picture
Tube generation, where it occurs extends one station beyond those specified.
, walls on or auto (or not specified), No plan scraps.")
Paperless survey (some LRUD), walls on or auto (or not specified), No plan scraps.
In this case Loch uses LRUD for tube dimensions and only for stations where partial data is provided, it guesses the missing data ie if a station has no LRUD data, no tube is generated.
And now adding some scraps again, and things get interesting.
, walls off (or not specified), Plan scraps drawn.")
Paperless survey (some LRUD), walls off (or not specified), Plan scraps drawn.
In this situation Loch uses scraps, not LR, for tube plan dimensions, and UD for height where specified, otherwise height is guessed. Where there are no scraps, LRUD is not used.
That is perhaps contrary to what one might expect from the Therion Book ‘walls’ entry.
It produces the best model.
, walls on or auto, Plan scraps drawn.")
Paperless survey (some LRUD), walls on or auto, Plan scraps drawn.
In this situation Loch uses both scraps and LR for tube plan dimensions, and UD for height where specified, otherwise height is guessed. Where there is no LR, then it is guessed. Where there are no scraps, LRUD is used. Not very pretty.
If I change the LRUD definition like this…
data dimensions station up down
1.4  20 20 #right hand end of picture
1.5  20 20
1.6  20 20
data dimensions station left right up down
3.13 10 10 20 20
3.14 10 10 20 20 #left hand end of picture
..then the guessed width troubles continue.
![Paperless survey (some LRUD), walls on or auto, Plan scraps drawn. [same as above]](/wiki/_detail/examples:modellochpaperless06.png?id=examples "Paperless survey (some LRUD), walls on or auto, Plan scraps drawn. [same as above]")
Paperless survey (some LRUD), walls on or auto, Plan scraps drawn. [same as above]
So my final conclusion, for paperless survey, no need to include walls statements in each survey, or if you do, walls off is better than on or auto. If you happen to provide some UD data, then your model will be improved (more realistic).
I surmise that with these same settings, scraps with point passage-height or point dimensions will have a similar effect, but I have not tested this.
Bruce
PS Note to self, point dimensions and passage-height do not have similar effects.
TO DO: experiment and document effect of these points. Consider effect in above scenarios,
- both point dimensions and passage-height
- points inside passage,
- points outside passage,
- different flavours of point passage-height