This is an old revision of the document!
Checking of Therion "environment"
You may check Therion's system variables easy - write into Command line options field in Compiler window “- -print-environment” and press Compile.
The result should look as:
therion 0.3.7
configuration file: perlovy.thconfig
reading ... done
INIT=/Caves/therion/lib
SOURCE=/Users/martin/.therion:/usr/share/therion:/usr/local/share/therion
METAPOST=mpost
PDFTEX=pdfetex
The INIT path is a place where Therion looks for therion.ini and xtherion.ini. Example is from MacOS X.
Editing text files in "Text Edit" window (F1)
- You may open several files. To choose one to edit you may click on list item in top-right corner of window. There are several other very helpful buttons, check them.
- You can change the font used in the editor and compiler log window. For example, a smaller font lets you read error messages without scrolling. Try adding the following line to Xtherion.ini
set xth(gui,efont) {courier -12}
Drawing
see also Therion by Examples Tips & Tricks
and Drawing Checklist Tips
List of all possible default symbols
To create a graphical list of all default map symbols for your current version of Therion,
EITHER open a command prompt window, navigate to a folder that is in Therions path, and type
Therion --print-symbols
OR enter –print-symbols in the compiler window options text box in XTherion, then click the Compile button.
This will produce a file 'symbols.xtml' in the current folder. See the Chapter 'Running Therion' in The Therion Book.
Creating and editing objects in "Map Editor" window (F2)
- The name of edited .th2 file and name of active scrap you may find in top border of window.
- Always check the “object setup area” on right side and “status line” on bottom of it. You may find there any necessary information with help to create object with correct parameters and in correct place.
- If you press the “Escape” key you leave the “Insert Mode” and switch to “Select mode”. The “Select mode” works in two steps - select - after first click you may check the parameters of object in “Status line” or “File commands” or “object setup area” and - move - after second click you may move with object.
- To add a line object, you may start to insert new line simple by pressing of Ctrl+L keys, you don't need to escape from “Inserting mode” first.
- Always check the small yellow tick on first point of line object. It shows the FREE space side of line. It means you should draw walls in counterclockwise direction, the blocks in clockwise direction, pit or chimney in counterclockwise direction, etc. If you made a mistake there is “reverse” option in “Line commands” section.
Finding Objects if you have large blank extents
If you have inserted an xvi or drawing image with large extents, it may be difficult to find the drawing objects by panning or zooming around the drawing interface.
An easier way to locate any drawing objects is to open the Objects window on the top right-hand side of the XTherion interface, and click on one of the objects listed.
Except for scraps, and areas, most objects will be selected and the drawing area will be panned to show the object mid-screen.
For example, clicking on object 4 below, selects it and brigs it to the centre of the drawing area.
If you are repeatedly creating th2 files with large blank extents around the drawings and images, then it may be because of spurious drawing lines made accidentally when navigating during data collection with PocketTopo, TopoDroid, SexyTopo or the likes. It may also be because of inappropriate parameters used (chosen by you or the application developer) to export data from these applications to Therion.
If drawings and export\imports are well posed, then your drawing area extents should not be much larger than your actual drawing.
You can manually or automatically tweak the drawing area that is viewable for a particular file if you scroll down to the Drawing Area window near the bottom of the right-hand side of XTherion, and make adjustments there.
Checking and erasing empty objects in .th2 files
It is quite easy to accidentally create empty objects while using XTherions Map Editor, in .th2 files. They look generally like this;
line floor-step
endline
or
area border

endborder
In the case of wall lines, they may cause complications generating 3D Loch files.
Use one of these regular expressions (regexp, grep) to search for such empty objects and replace them with empty strings:
^\s*(\w+) (\w+)(\-|)(\w+)\s+end\1
or
^\s*(\w+) \w+(-?)\w*\s+end\1
(If you copy and paste these strings, make sure you trim any leading or trailing spaces, else they will not work as intended - the internal spaces are required though)
You can use XTherions Map Editor 'search and select' to find empty objects using these regular expressions, one file at a time, or use your favourite Text Editor to open a whole project worth of files, and remove them all in one find and replace step. If you do it this way, make sure you are using Version Control so that you can review changes made and back out of any unintended changes!
Changing the subtype of line
A wall does not need to be divided into small parts according to subtype. You can use one line of type wall and assign the appropriate subtypes to line points from beginning of line (where the small yellow tick is). The subtype bedrock will return the line wall back to default (solid rock) type.
The symbol may have an attribute subtype. The subtype is very common for line symbol wall. You may use these subtype for the wall: invisible, bedrock (default), sand, clay, pebbles, debris, blocks, ice, underlying, unsurveyed, presumed.
You change the subtype of the point in on the wall in the small black window in Line point control part of control panel. Simple write there subtype xxxx (no dash). This changes the subtype of the wall from that point on, until the end of the line or the subtype of another point is changed.
Imagine you have part of the wall pressumed - there is a wide crawling and you are not able to recognize one of the walls. At first point of missing wall you assign subtype presumed and at the end of missing wall you assign to the point of wall line the subtype bedrock.
You may assign only one subtype for one line point.
Scrap Drawing Tips
Pitch Drawing Tips
Surface Drawing Tips
Using map connections
Using elevations
Drawing Order How to draw symbols over or under an area
For example, allowing sand or rocks under or above the water surface or within sump.
You can draw symbols above or below an area, or even one area above another, but controlling visibility of the underlying symbols requires some care and understanding of how Therion works. There are also built-in limitations to the visibility of symbols that underlie symbols that have a background fill as part of their definition, they are only visible when 'transparency' is set to 'on'. If you view the pdf output with Adobe Acrobat or Reader, even the transparent outputs are displayed opaque (a bug in those applications?). And when you have a better pdf viewer and transparency is on, perhaps a little frustratingly, everything is transparent.
Firstly, as you draw in XTherion;
- the entity you draw will be placed above the previously selected entity (both in the finished output and within the th2 text file),
- each entity is drawn above the previously drawn entity,
- entities that appear first within a scrap are drawn on top of all other entities ie last ones drawn are at the start of the scrap
(that's the same thing said three different ways I think)
Secondly, it's easier to have only one area, and place points or lines above or below it. You can deal with multiple areas in one place, but as alluded to above, it gets confusing to sort out what is visible and by how much.
Thirdly, when resorting to moving area entities up and down in the th2 file with a text editor, always move the border defining the area with the area (helps if you draw a border specifically for each area or collection of areas, this way the defining border will usually appear directly below the area definition in the th2 file if you have drawn in the sequence; border then area.
Fourthly, the first point is a generalised simplification. Therion has three default 'layers' (NOT the layers that appear in the pdf files - these are different) that it places entities on (the drawing order still controls positions within each layer as described in the first point above).
As described in the Therion Book, How the map is put together, the layers are 'default-bottom', 'default' and 'default-top'. 'Default', as you might guess is in the middle. Areas go to the bottom, ceiling-step and chimney go to the top, everything else is somewhere in the middle.
Now if you find that you have not drawn an entity in exactly the right order to get that special effect you were after, there is an over-ride. There are two more 'layers', 'top', and 'bottom' and these are placed by Therion above 'default-top' and below 'default-bottom' respectively. To put an entity in either of these layers, add the option -place top or -place bottom. If using -place for an area it is probably a good idea to use -place for its defining border as well. There is then an upper layer on top of 'top', which is the layer containing any items that have '-clip off', since these are rendered after all items that take part in normal clipping. If you have an entity without '-clip off' that needs to be rendered on top of an entity that has '-clip off' (eg. a ceiling step that must appear on top of a boulder when the boulder-edge has '-clip off'), then you will need to give the first entity (the ceiling step in the example) '-clip off' as well. These non-clipped entities are then layered with respect to each other respecting the usual -place and stacking orders.
Fifthly, transparency and opacity settings come into it, as well as the particular viewer or printer driver you are using, as indicated in the first paragraph above. Everything will be opaque unless you have in your layout
transparency on
opacity 50 #or some other appropriate value 0-100
And just to complicate things a little more, this forum thread explains why defining special transparent colours with custom metapost code will not affect the transparency of elements within the same scrap (5.3.10) http://article.gmane.org/gmane.comp.gis.therion/3406/match=transparent+colours
It contains images produced with 'transparency on', but viewed with Adobe, Evince and Foxit Readers. Only the Foxit Reader (Nov 2012) renders the symbols as per the instructions given to Therion (both wrt transparency and symbol pattern fills).
If all else fails you may need to put offending symbols or areas on another scrap and place it under or over the scrap you are working on. I sometimes define scraps without walls, most symbols will then need -clip off (Don't use break if your new scrap has no walls defined v5.3.3)
Avoiding Invisible or Misshapen Scraps in Loch and Google Earth
Over time the pdf outputs have become resilient to many drawing misdemeanour's, and so you can break many of the rules described in the Therion Book, and still get a pretty good (or even perfect) output. But the Loch model and Google Earth map outputs are not yet so versatile (2011 - 2021), and often result in missing or miss-drawn pieces of cave passage.
Here are the usual culprits.
| Misdemeanour | Symptom |
|---|---|
| * line wall with incorrect 'reverse' status (yellow tick should point inside passage void) | Invisible passage. Loch walls appear and vanish as you rotate the model |
* line wall that is completely enclosed by a single scrap (such as for an oxbow passage) that does not have -outline in option set. | Interior of loop is rendered and passage may be invisible |
* line wall that is completely enclosed by a single scrap (such as for an oxbow passage) but is not continuous and closed. Hint: Close intentionally open ends that are completely enclosed by a single scrap with a line wall -subtype invisible to solve this problem. | Interior of loop is rendered and passage may be invisible |
| * An open passage end has one or more wall ends that curls back into the interior of the passage. | Invisible passage |
| * A scrap has open space along it's length. ie openings left for side passages directly opposite each other break the scrap in half. | Only one of the parts of the scrap are rendered |
* Scrap is wider than it is long, or has long walls with -subtype invisible, or very complicated scraps | These are not necessarily misdemeanours, but I think it might cause the passage to be invisible. |
| * Passage wall has a loop in it, either because the bezier curve handles have been extended too far, or because the subsequent morphing when scraps join has encouraged a loop to form | probably invisible passage (not verified) Metapost gives a 'scrap outline intersects itself' warning |
* Therion cannot handle two consecutive wall:invisible lines joining each other (5.3.9 Nov 2011) Try making the two invisible lines into one long invisible line or make one of them -visibility off instead | Passages have gaps and strange artefacts emanating from them |
* A line with -outline out is connected to a line with -outline in | Passages have gaps and strange artefacts emanating from them |
| * Instead of abutting end to end, a pair of line wall overlap each other, the first segment of one line with the last segment of another | Loch model contains large spurious artefacts |
Tips
Beware of survey stations being undefined where they are at the exact same location as another defined station. Can lead to “invalid scrap outline” errors where everything else looks good. Generally won't affect most outputs but Loch complains about these errors and can lead to very long compile times.
It means in one scrap. So first of all check such misplaced stations by this workflow:
| - Create new .th2 file, |
| - insert backgroud sketch, |
| - create a new scrap, |
| - add stations, |
| - add to thconfig file source file.th2, |
| - export map with -layout-debug on option, or debug on switch in layout section, (see how_do_i_use_debug_mode_in_layout) |
| - check in exported PDF if there are not strange misplaced stations, |
| - continue with drawing of scrap itself, |
| - use debug on frequently to check quality of a drawing . |
Moving lines and scraps within drawing area
If you want to rearrange objects in drawing area, you sometimes need to move whole line or entire scrap. To do this, follow these steps:
- Select coordinates that define the start of the movement vector. Click ‘shift from’ in ‘Objects’ tool to populate the 'shift from' coordinates boxes. (The easiest way to select coordinates is to right-click a blank space in the drawing area. More precise, but tedious ways, are to create or select an existing point object (or line point), or type coordinates directly into the 'shift from' coordinate boxes).
- Select coordinates that define the end (destination) of the movement vector. Click ‘shift to’. (The comments above regarding selecting coordinates apply).
- If you did that in the wrong order, click ‘Swap’ to swap the vector coordinates. ‘Swap‘ and ‘Shift object’ works as undo too.
- Select the object (point or line or entire scrap) that you want to move. Click ‘Shift object’. (A scrap object needs to be selected using the 'select next scrap' button, or using the Objects tool).
- Repeat step 4 until you have moved all the objects that you wish to move.
Joining scraps together
One of Therion's key features is that drawings are created in small pieces - scraps. A scrap is the smallest indivisible part of the drawing that can exported to create an output.
Most maps contain many scraps, and if they don't happen to appear perfectly joined by coincidence, then you should “join” these individual scraps to get Therion to morph them together.
Important: Only use the join command if it is necessary to do so. ie when there are open passage ends or drawing lines that should be joined in the final output, but are not.


Do not use the join command if your adjacent scraps do not have any lines that need to be joined.  An example of this would be a higher passage approaching the top of a pitch, and a lower passage that continues from the bottom of the pitch.  Both the upper scrap and the lower scrap might be drawn with closed ends around the top and bottom of the shaft respectively.  These overlapping scraps would not normally need to be joined, and using the semi-automatic approach described below will guarantee extreme distortion!
How to join scraps
There are three ways to join scraps, or components of scraps;
- fully automatically in *.th2 file,
- semi-automatically scrap by scrap, and
- manually line or point by point (if you must specify exactly which lines and points join).
For any particular pair of lines or points to be joined, you should only use one of these methods. Multiple joins of the same set of objects is likely to give unpredictable results! The last two methods are described in Thbook and all three are described below.
Join commands can be put directly into a survey definition, but not usually inside scrap or map definitions.
Fully automatic in *.th2 file
If you draw two or more scraps adjacent to each other in your drawing *.th2 file, and make sure the adjacent line wall ends snap to each other, then Therion will automatically morph them, if necessary, to create a perfect join. A morph might be necessary, if for example survey closure or other drawing distortions might tend to separate the scraps you have drawn as touching.
This is really just an automatic implementation of the 'Manual line or point by point' method described below.
In fact, any points or line points (not just open ends of passage walls) drawn coincident (snapped together) in a th2 file will be morphed in the output to also be coincident.
Semi-automatic scrap by scrap
join scrap1 scrap2 [-count <number of passage (not line) joins for Therion to look for>]
The method can only join two scraps at a time. Note that it only works using passages defined by lines of “wall” type (even if their “-outline” is set to “none”). It does not join other types of line. It normally expects to find pairs of lines, one on each side of the passage opening. If there are multiple places where the two scraps join, you can normally use the “-count” option to say how many possible passage joins Therion should search for and join in the two scraps.
Manual line or point by point
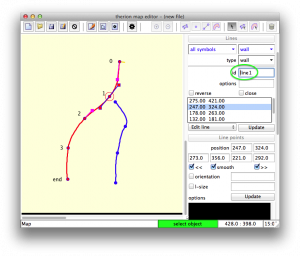
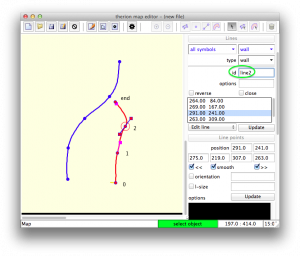
From time to time the semi-automatic way does not work, or you want more refined control. Then you should join each line or point to the other line or point (usually, but not only walls). If you have several objects to join at one point, then unlike the scrap by scrap join above, you should use one join statement to join them all in one go (see bottom of this topic). Every point on a line has a mark according its sequence from beginning of line (yellow tick). The first one has mark 0, next one 1, etc., last one is mark “end”. So the join command will be:
  join line1:1 line2:end
      or in the other case it could be;
  join line1:0 line2:31
      or if the scraps are within another survey;
  join line1@MiddleEarth:0 line2@MiddleEarth:31
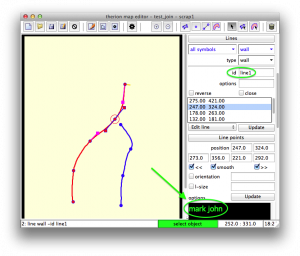
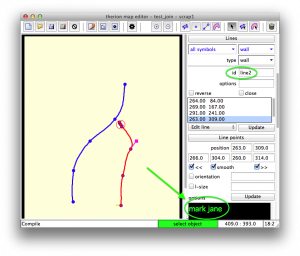
It is quite tedious to determine what the number of line point mark 31 is. There is another way - add to the point an easy to remember mark, such as “john”, “jane”, …
  join line1:john line2:jane
      or if the scraps are within another survey;
  join line1@MiddleEarth:john line2@MiddleEarth:jane
Map with joined lines:
You may use join command to join line to line or line to point. So if the beginning of a particular passage is between two blocks you may join walls of passage to points of rock-borders. After the morphing the beginning of passage will be still connected to blocks.
The lines (just like maps, scraps, points and stations) are referenced by their ID directly inside their survey - inside a subsurvey, this would be as id@subsurvey (or id@subsurvey.subsurvey for nested subsurveys) - so make sure you have assigned an ID to each line that needs to be joined using the join command.
If you want to join three or more lines and or points, do all the coincident joins in a single command, eg
join line1:john line2:jane line3:jack line4:jill
If you refer to the same point in more than one join statement, then one of the joins will be ignored.
For more detail see Therion by Examples, chapter 3 and how_do_i_join_three_scraps_in_a_y-shape
How to export correct extended elevation from zig-zag centerline
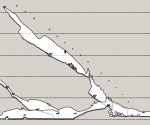
Very common problem, when drawing extended elevation of steepy and large passage where centerline is from practical reasons zig-zag and automatic generation of centerline will increase real length of passage.
In Survex and in Therion there could be label no survey in data structure definition command.
Example:
  data normal from to compass length clino
  18    18.2  285     7.81  +33.8

  data nosurvey from to
  18.2 18.5

  extend ignore 18.4 18.5

  data normal from to compass length clino
  extend ignore
  18.2  18.3  15     13.72  +23.1
  18.3  18.4  280    14.27  +23.4
  18.4  18.5  188    11.29  +19.8
  extend left
  18.5  18.6  271    10.16  +28.4
  18    18.1  127    10.20  -26.3
  18.4  18.8  257    14.45  +32.5
  18.6  18.7  248    15.17  +31.1
  18.6  18.9  261    30.84  +45.3
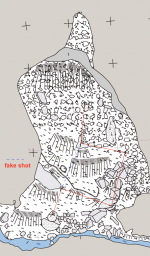
Command data nosurvey from to means there will be created fake survey shot from station 18.2 to 18.5, but this survey shot will play in extended elevation generation.
To prevent interaction with survey shots from station 18.2 to 18.3, 18.3 to 18.4 and 18.4 to 18.5 there is another command extend ignore what mean those shots will be not included in extended elevation generation.
Final result should be as on images:
See also Extended Elevations page for comprehensive extended elevation guidance.
Showing centreline for parts of a cave, and passage walls for others
Sometimes you might have full survey data and drawings for some parts of a cave, while other parts might have only centreline data. It is possible to combine these in the same PDF output, using a map consisting of other maps, and other surveys:
map allcave
  subsection_map@subsection #the part with walls drawn
  othersubsection_survey    #the survey containing a part without wall drawings
endmap
Note that you now cannot use “symbol-hide group centreline” or any equivalents to hide the centreline in your scraps, since it will also hide these centrelines that do not have any wall drawings. Instead, you need to hide it within the scraps using metapost.
Making a subset of the cave take its altitude colours from a larger part of the cave
When rendering a map (map-endmap), with “color map-fg altitude” enabled, the default automatic altitude colour bands take their highest and lowest values from the highest and lowest survey stations for the parts of the survey that are used in the rendering. It takes all the survey stations within the “cave” (ie. not in a “flags surface” section), from whichever surveys and subsurveys have some of their parts included in the map, and finds the highest and lowest station. This happens even if the highest and lowest stations within those surveys are not even rendered because they are not included in a scrap.
When you want to render a subset of that cave, such as a map showing only the entrance series of a cave, you might want to have the colours match the colours that were used in the overall map, so that the parts of the cave are recognisable. One way is to use an altitude lookup.
Another approach, which allows Therion to continue using automatic altitude colours, is to include the highest and lowest surveys/subsurveys in your map, and then use symbol-hide to hide those surveys. If you don't know which part of the cave will be the highest or lowest, just include all of them, to be on the safe side.
map foo
  subsection_map@subsection #the part you actually want to render
  othersubsection_survey    #the survey containing the highest part of the cave
  anothersubsection_survey  #the survey containing the lowest part of the cave
endmap
Your layout would then include this:
color map-fg altitude
symbol-hide group centreline
By hiding the centreline, you cause the unwanted surveys not to render at all, so the output acts like they were never included (it is cropped accordingly to show only the rendered part).
Including some centreline data
If you need to include a centreline-only section of the cave in your rendering, then you cannot use “symbol-hide group centreline”. However, the same basic approach for getting the correct vertical range works, but it is a little more convoluted. Create a scrap in the highest and lowest parts of the cave. Those scraps should contain only a single station point. It doesn't have to be the highest or lowest station, since simply including any station causes all of them within that survey to be considered for the highest and lowest points. Give that station the “-visibility off” option:
scrap emptySP -projection plan -scale [1 10 1 10 0.0 0.0 10 10 m]
  point 1 1 station -name 2 -visibility off
endscrap
Include that scrap instead of including the survey itself. You will then also need to use MetaPost to hide the tiny bit of centreline that Therion will try to show at that hidden station. Unfortunately, Therion will still leave the space for that centreline even though you asked it not to draw anything, so it will not crop the survey to the appropriate size. To solve this, you need to include the scrap within a map:
map othersubsection_one_station_map
  emptySP
endmap
Then include that map with an offset, pushing it into the normally visible area of the survey (the same position as the passages that you want to show). This seems convoluted and takes a little time to set up perfectly, but it works.
map foo
  subsection_map@subsection #the part you actually want to render
  centreline_only_survey #the survey that contains only centreline data without any passage drawings
  othersubsection_one_station_map@othersubsection [123 456 m] none #the survey containing the highest part of the cave
  anothersubsection_one_station_map@anothersubsection [-23 12 m] none #the survey containing the lowest part of the cave
endmap
Map Layout
How to make map outputs match ISO paper size proportions
from Chris Hayes
ISO paper sizes have an edge length ratio, H:W, of √2:1, or vise versa. However when exporting maps to pdf, Therion makes the pdf exactly match the bounds of the cave, plus any images or legend elements that we might include with the layout. This does not typically match an ISO paper size, or the proportions thereof.
If we want our exported map output to scale nicely to print to a standard paper size (e.g. A4, A3, A1) then we need to cunningly include a map-header and or a map-image element to nudge the size of the pdf 'paper'.
- Compile a map with
map-header 0 100 nwandmap-header 100 0 seto get the dimensions, H and W of the pdf, then modify the map-header specification and compile again.
- For portrait outputs; add / remove
delta H = 50*[√(2)*W/H -1]to the y positions - For landscape outputs; add / remove
delta W = 50*[√(2)*H/W -1]to the x positions
# Example for a portrait output, with modified y positions
map-header 0 109.79986718266315 nw               #place map header in top left corner
map-image 100 -9.79986718266315 se Club_Logo.png #place an image such as club logo in bottom right corner
The output will probably not match an ISO paper size that you have in your printer, but it will be of the correct proportion to be scaled to fit thatISO paper size.
Map-image and custom legendbox
If you customise your legendbox in the tex-map section of your configuration file layout and use
\def\maplayout{...
    }
then map-image will not work. To work around this simply rename it as shown below
\def\new_maplayout{
  \legendbox{0}{100}{NW}{
    \the\legendcontent
    }
Multilingual Legend / Legend Formatting
Produce a multilingual legend on your map and format it to display correctly.
use text substitution to achieve this in thconfig file.
Source cave.th
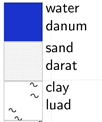
text en "area sand"      "sand<br>darat"
text en "area water"     "water<br>danum"
export map …''
This works great except the formatting of the legend is borked. As you will see the text is vertically aligned with the middle of the text against the top of the legend box by default.
To correct this the you need to modify \legendsymbolbox by adding it to the tex section of your thconfig
\def\legendsymbolbox#1#2{%
\setbox\tmpboxa=\hbox{\pdfrefxform#1}%
\setbox\tmpboxb=\hbox{\the\legendtextsize(}%
\legendsymbolwd=\wd\tmpboxa
\legendsymbolht=\ht\tmpboxa
\advance\legendsymbolht by -\ht\tmpboxb
\advance\legendsymbolht by -\ht\tmpboxb   ##  Add these rows ##
\advance\legendsymbolht by -20pt          ##  Add these rows ##
\advance\legendsymbolht by -1dd
\tmpdimen=\hsize
  \advance\tmpdimen by 10pt
  \divide\tmpdimen by\legendcolumns
  \advance\tmpdimen by-10pt
\hbox to \tmpdimen{%
   \box\tmpboxa\kern10pt\raise\legendsymbolht\vtop{%
     \advance\tmpdimen by -\legendsymbolwd
     \advance\tmpdimen by -10pt
     \hsize=\tmpdimen\rightskip=0pt plus \tmpdimen minus 0pt\relax\the\legendtextsize #2\vskip1dd}\hss}%
}''
The code above taken from thTMPDIR\data.tex was modified as shown to produce the desired effect. You might need to tweak this to your needs.
Changing \legendsymbolbox will also affect your altitude legend if you are using color map-fg altitude. To correct this you need this code:
\def\colorlegendbox#1#2#3{%
#\setbox\xxx=\hbox to 36bp{\PL{q #1 #2 #3 rg 0 0 36 24 re f Q}\hfil}%
\setbox\xxx=\hbox to 125bp{\PL{q #1 #2 #3 rg 0 0 360 224 re f Q}\hfil}%
#\ht\xxx=25bp\dp\xxx=0bp
\ht\xxx=125bp\dp\xxx=10bp
#\xxx\ht{200pt}
\immediate\pdfxform\xxx
}
you can see from the comments the parts you need to change to get your desired result
Hiding particular symbols from legend
Sometimes you might want to hide just one particular symbol from the legend.
This is as simple as setting the legend text for the symbol to an empty string, “”
This is done within the thconfig file.
eg
text en "line border:visible" ""
text en "line border:temporary" ""
text en "line border:presumed" ""
With this example, none of these borders will appear in the legend, even if these lines are used in the drawing.
Drawing a symbol on the legend which is not used on the map
Therion allows you to embed one PDF (eg. an elevation survey) in another PDF (eg. a plan survey), so that two views of the cave can be displayed together. When doing this, you normally only want one copy of the legend, so you would disable the legend on one of them. The survey being embedded may use symbols that are not used on the main survey, and those symbols would not be shown on the main legend.
To fix this, use the same symbol somewhere on the main survey. Place it outside of the cave outline, so it is not within a passage. If it has “outline out” by default (such as a wall), set “-outline none”. If it has “clip off” by default (most point symbols, some line symbols such as water-flow and label), set “-clip on”.
The symbol will not be visible on the main survey, but it will be in the main survey's legend. A nice and simple solution.
Note that it is not possible to use this approach with symbols that display differently in plan and elevation view (eg. handrails), and there does not appear to be an easy solution to that. The only alternative would be to export a custom PDF survey that uses only that symbol, a box line around it, a text label to one side. Try to make it look like a legend item. Embed it into the main survey just below the legend. This is an ugly hack.
Atlas Layout Parameter Calculator
Small spreadsheet to help create Atlas page layouts © Bruce Mutton 2008. On entering 7 input variables, (paper size, margins, navigator etc) you can copy and paste the required 12 variables into your Therion layout in a single operation.
RGB to Therion Colour Mapping Calculator
Small spreadsheet as an example of one way to find out and record rgb parameters required to create colours in Therion © Bruce Mutton 2008.
Choosing Colour Palettes
A useful resource found (for Therion users) by Martin Sluka…
Color Brewer choose colour schemes to represent sequential, diverging or qualitative data. Copy and paste the edfinition into your Therion layout.
Qualitative or diverging might be good for differentiating related caves in the same map (can users of Therion control this? - don't think we can yet). Any of the schemes might be good for differentiating particular sets of symbols like water from floor sediments to archaeological, organic, rigging or route finding features.
  symbol-colo[u]r <point/line/area/group/special> <symbol-type> <colour>
  # see Therion Book section on layout, pg 51 for 5.3.11
More information here http://mkweb.bcgsc.ca/brewer/
Take care that the final colour will strictly depend on setup (calibration) of your screen, system, application and printer or data projector!!!
Reconstruction of surveying data from paper map
There is map to data converter program on Compass software page
Comment from Graham Mullan:
That program is part of Larry Fish's “Compass” suite. It is perfectly safe to use. The one thing to remember is that its output is a Compass data file which means that whatever you think you did when using it, it will automatically convert all lengths to decimal feet. This is not an issue just as long as you remember it. I've used it a number of times, but only on small caves or mines, so I've had little problem editing the output into a therion or survex file by hand - and remembering to add the line “tape units feet” to it.
It looks, last version is able to work in meters too:

It runs only on Windows, but under Wine without problems too.
Rescaling Therion map files to match rescaled images
Sometimes you might have a Therion map that has been drawn based on image of a cave sketch that was scanned at say 300 dpi. If you need to reduce that image size later on to say 100 dpi you rescale the image to be 3 times smaller. But now your Therion map does not match with the background image anymore! You need to divide nearly all the pixel values in the th2 map by 3 times - but not all values. I do this with a little Python program e.g. ./scale_th2.py oldmap.th2 3.0 > newmap.th2. It probably only works for some th2 files as it only tests for a few cases. Use with care. zipped scale_th2.py
Hide altitude label of wall points
symbol-hide point wall-altitude


